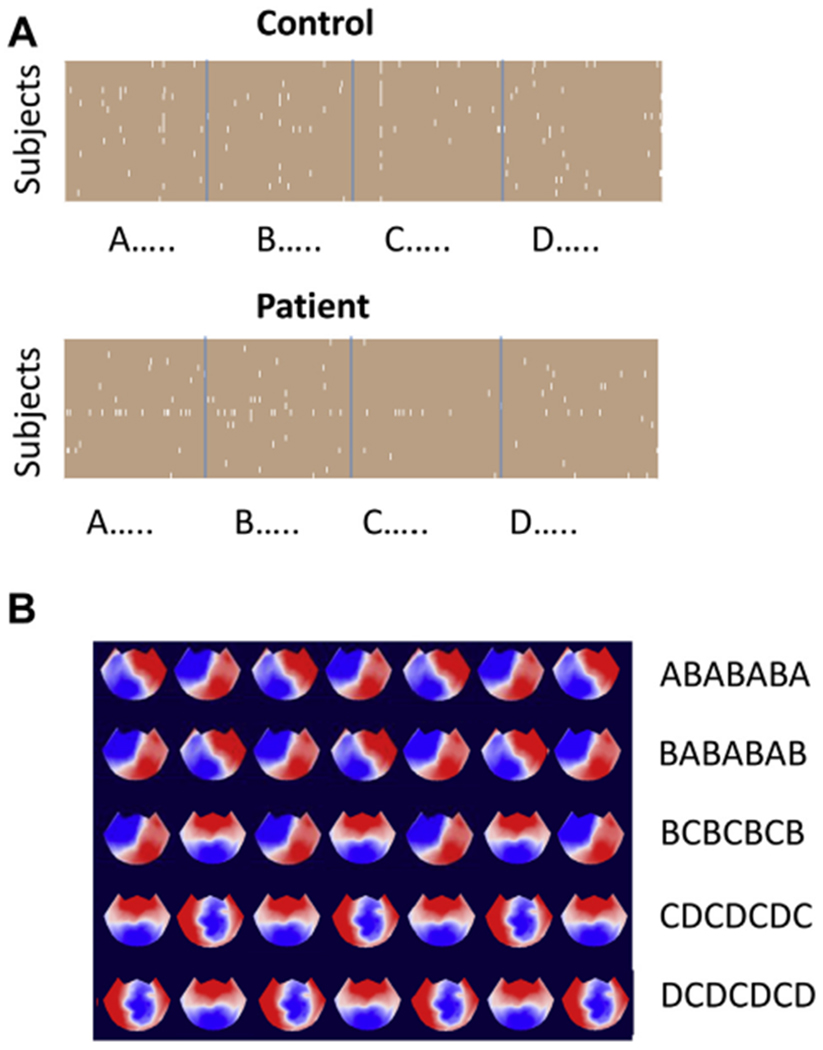
Figure 3.

Analysis of microstate patterns of length 7. (A) Plots for control subjects and patients showing which patterns were statistically more likely than chance (white) in control subjects and patients. (B) The microstate patterns that occurred above chance in more than half of all control subjects.
