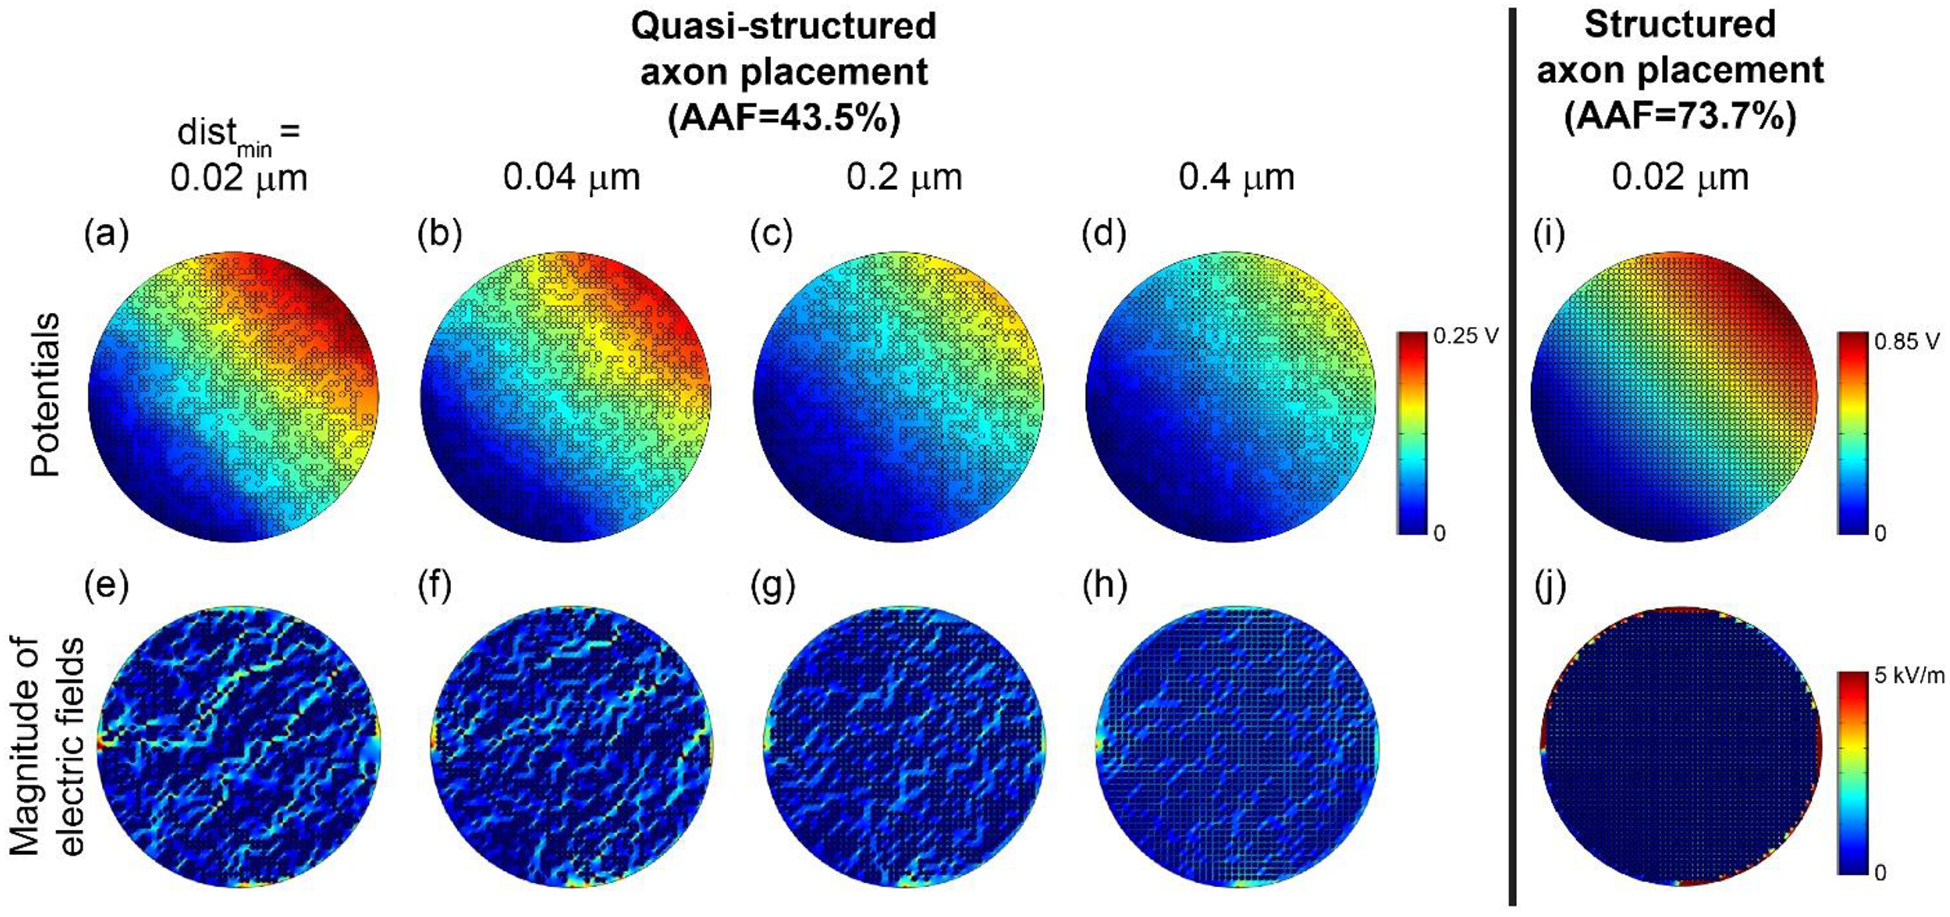
Figure 7.

Potential distributions (top row) and electric field magnitudes (bottom row) with increasing minimum distance (distmin) between object boundaries (from (a) to (d) and (e) to (h)). In all cases, we initially placed 2 μm axons in a grid formation in a 105 μm fascicle ((i) and (j)). Then, we randomly removed axons to achieve AAF = 43.5%. The colour map of the electric fields spanning 0 to 5 kV/m is the same as Figure 5 to permit direct visual comparison.
