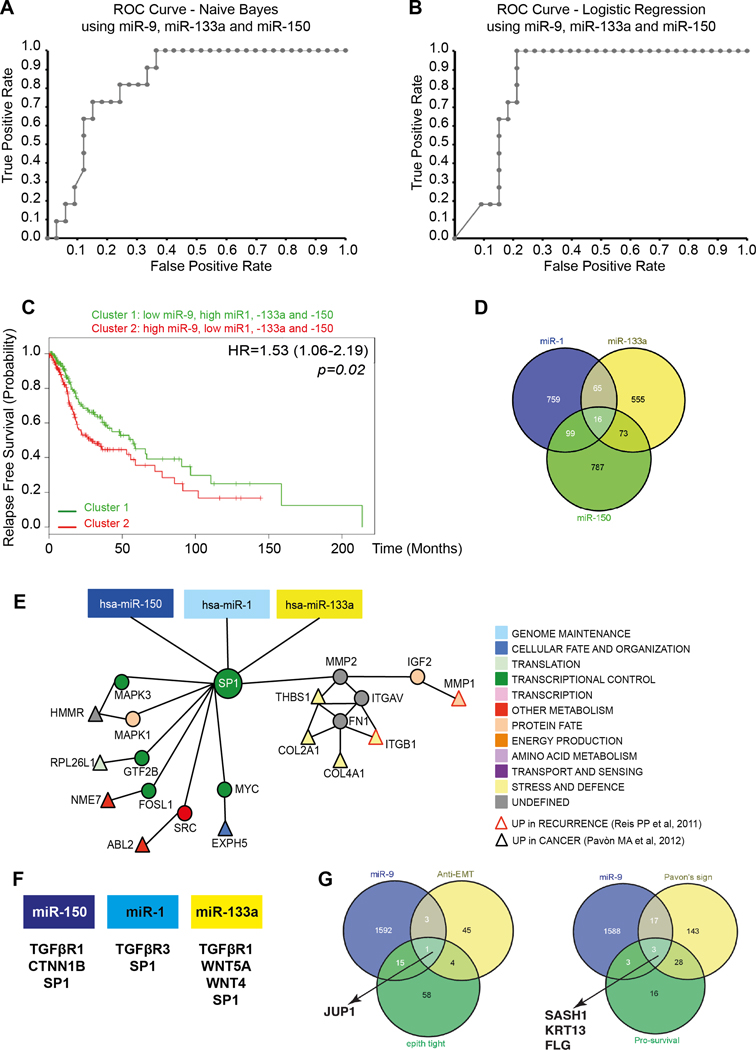
FIGURE 1. Identification of miR-1, −133a, −150 and −9 potential targets in HNSCC.
A/B. ROC curve predicting recurrence formation, using miR-9, 133a and −150 data iteration, applying the Naïve Bayes (A) or the Logistic Regression (B) models. The AUC is 81.3% (Sensitivity 87% and Specificity 75%) in A and 80.3% (Sensitivity 82% and Specificity 71%) in B.
C. Kaplan-Mayer curve evaluating progression free survival of HNSCC patients clustered based on the expression of miR-1, −9, −133a and 150.
D. Venn Diagram showing the number of miR-1, −133a and −150 common potential targets, among the EMT genes, altered in HNSCC.
E. Visualization of miR-1, 133a and −150 and SP1 network in HNSCC. Direct interactions are shown by edges. Red-border triangles identify genes upregulated in recurrent HNSCC and black-border triangles identify genes upregulated in HNSCC primary tumors
F. List of miR-1, 133a and −150 targets belonging to the TGFβ and WNT pathways.
G. Venn Diagram showing the number of miR-9 potential targets, among the anti-EMT genes and among the genes altered in HNSCC.

