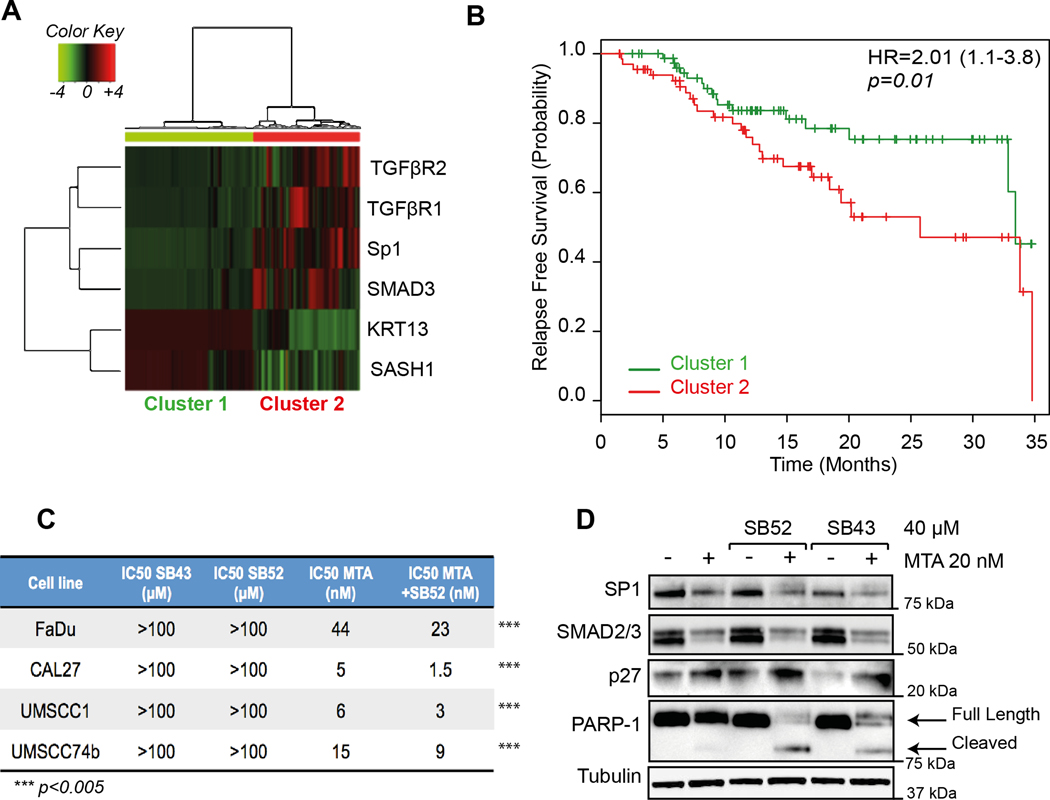
FIGURE 4. Expression of miRs targets predict prognosis of HNSCC patients in the TCGA dataset.
A. Cluster analyses of TGFβR1, TGFβR2, SP1, SMAD3, KRT13 and SASH1 in HNSCC samples included in the TCGA dataset.
B. Kaplan-Mayer curve evaluating progression free survival of HNSCC patients divided based on the cluster analysis shown in (A). Hazard ratio (HR), Confidence Interval (between brackets) and significance (p) were evaluated with the log-rank test using the survival package in R.
C. Table reports the IC50 values of SB431542 (SB43), SB525334 (SB52) and Mitramycin A (MTA) alone or in combination with SB52 (40 µM) in the indicated HNSCC cell lines. Significant difference (*** = p<0.0001) between the IC50 of MTA, in the presence or not of SB52, was calculated with unpaired two-tailed Student’s t-test.
D. Western blot analysis evaluating the expression of SP1, SMAD2/3 (readouts of MTA activity), p27 (readout of SB52/SB43 activity) and PARP-1 (cleaved form used as marker of apoptosis) in FaDu cells, treated for 24 hours with 20 nM MTA, 40μM SB52 or SB43 or their combination, as indicated. Tubulin was used as loading control.

