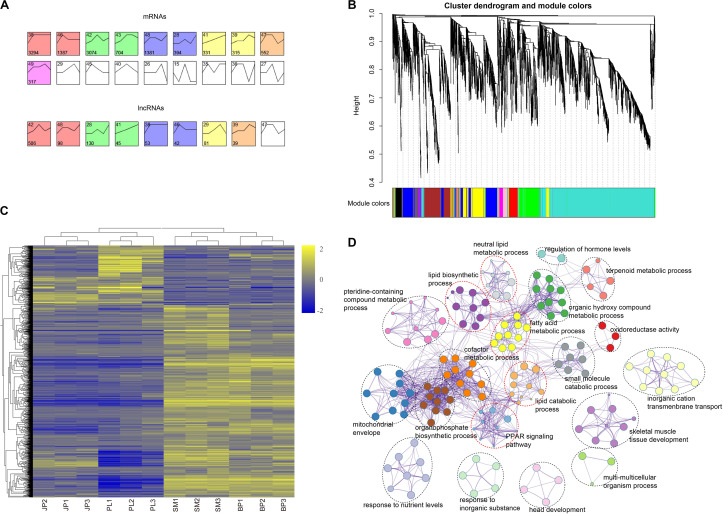
FIGURE 4.
Time-series model and co-expression networks of lncRNAs and mRNAs. (A) Time-series modules of mRNAs and lncRNAs. The top panel shows mRNAs and the second panel shows lncRNAs. Numbers in the top left corner indicate module number. Numbers in the lower left corner indicate number of mRNAs or lncRNAs in each module. The same color was used to represent each cluster. (B) Co-expression network constructed by the WGCNA method. The top panel shows cluster dendrogram obtained by average linkage hierarchical clustering. The low panel shows co-expression modules of lncRNAs and mRNAs with different colors. (C) Heat map showing the mRNAs corresponding to the largest three co-expression network modules of lncRNAs. Values in heat map represent log2(FPKM + 1) of each mRNA in each sample minus the mean value of each mRNA across all samples. (D) Functional categories of the mRNAs corresponding to the largest three co-expression network modules of lncRNAs.

