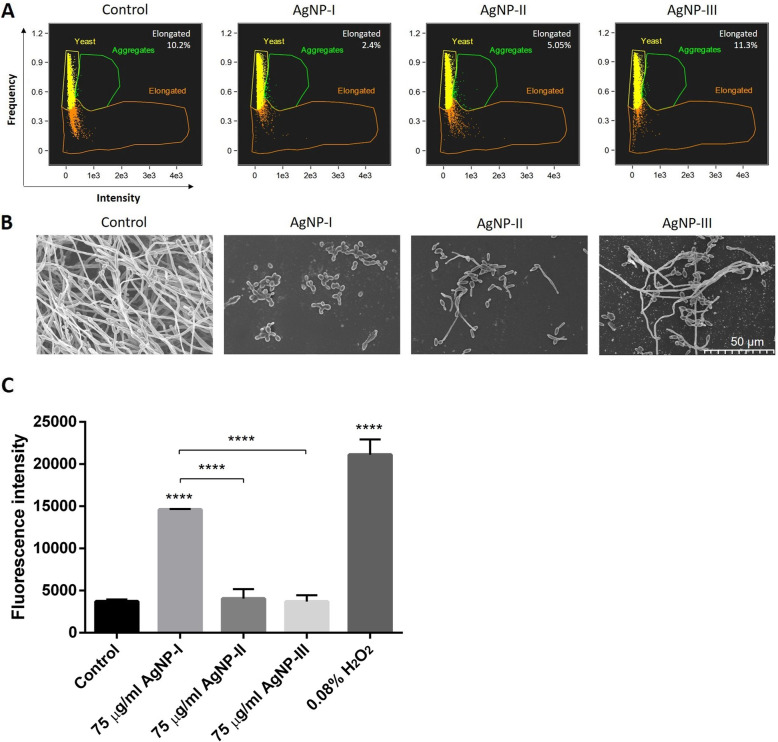
Fig. 4.
Morphology of control and AgNP-treated C. albicans cells. Cell morphology of untreated and AgNP-exposed C. albicans was detected by flow cytometry after 72-h incubation in the presence of differently sized AgNPs in 75 μg/mL concentration. The percentage of aggregated, yeast-shaped and elongated cells were quantified by IDEAS 6.2 software (Amnis-EMD Millipore, Burlington, MA, USA) and the percentage of elongated cells is indicated on the figures (a). Morphology of the surface-anchored cells after 72-h incubation in the presence of AgNPs was analyzed using scanning electron microscopic images (b). In order to assess the degree of reactive oxygen species formation, mean DCF fluorescence intensity was determined on DCFDA-stained, AgNP-treated C. albicans cells. Values represent the mean ± standard deviation calculated from three independent experiments (****, P < 0.0001, unpaired t test) (c)

