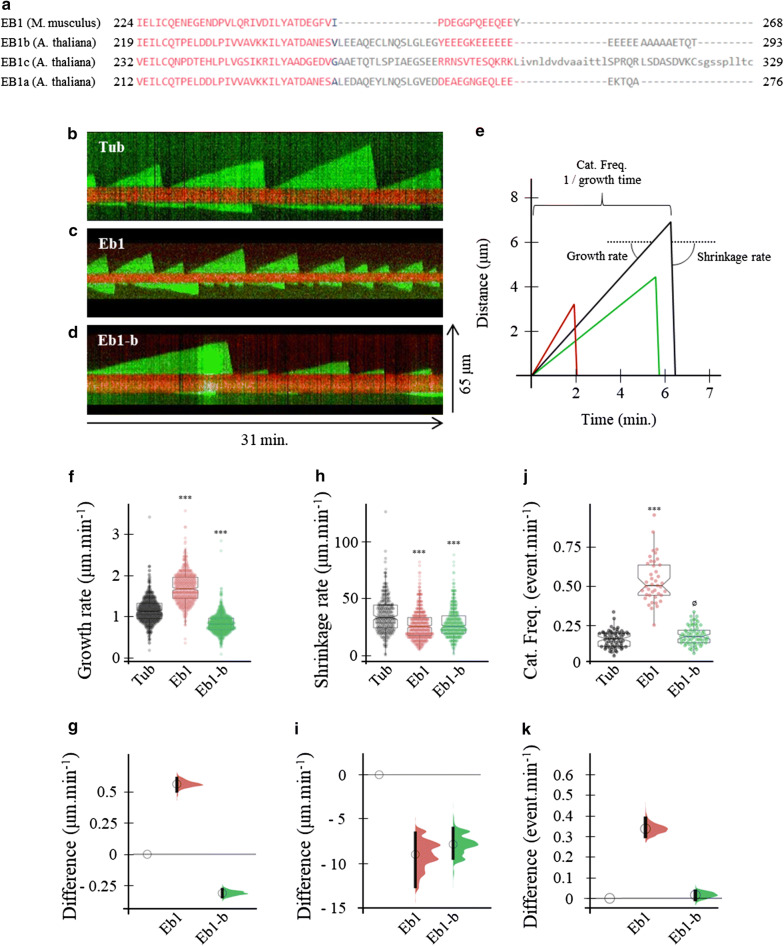
Fig. 1.
Comparison of the effect of mammalian and plant EB1 protein on microtubule dynamics. a Protein sequence homology between EB1 proteins from mice (Mus musculus) and plant (Arabidopsis thaliana). Mice EB1 (Q61166.3), EB1a (Q7XJ60.1) EB1b (Q9FJJ5.1) EB1c (Q9FGQ6.1). Note that the final EEY motif found in the EB1 proteins from mice (and other mammals) is not present in the plant EB1. Representative kymographs of microtubule seeds (in red) growing in presence of 15 μM of tubulin (b), 15 μM of tubulin and 75 nM of EB1 from mammals (c), and 15 μM of tubulin and 75 nM of EB1-b from plant (d). All kymographs are oriented with the + end to the top. e is a schematic of the ideal microtubule tracks for each condition based on the average parameters of their dynamic instability estimated from the kymographs in (b–d). The schematic also shows how the parameters are estimated from the kymographs. Graphs in (f–j) show the growth rate (f), the shrinkage rate (h) and the catastrophe frequency (j) of microtubules grown in 15 μM of tubulin (black), 15 μM of tubulin and 75 nM of EB1 from mammals (red) or 15 μM of tubulin 75 nM of EB1-b from plant (green) as jittered dots (visibility: 0.1). The summary of the data is shown as a boxplot, with the box indicating the interquartile range (IQR), the whiskers showing the range of values that are within 1.5*IQR and a horizontal line indicating the median (visibility: 0.9). The notches represent for each median the 95% confidence interval (approximated by 1.58*IQR/sqrt(n)). Asterisks indicates statistically significant difference, (p < 0.001) obtained from the bootstrap analysis (see methods for details). Plots in (g, i, k) show the absolute effect size, relative to the 15 μM tubulin condition for the growth rate (g), the shrinkage rate (i) and the catastrophe frequency (k). The bootstrap samples that are used to calculate the 95% confidence interval of the effect size are shown as a distribution. 95% confidence intervals are represented as black bars

