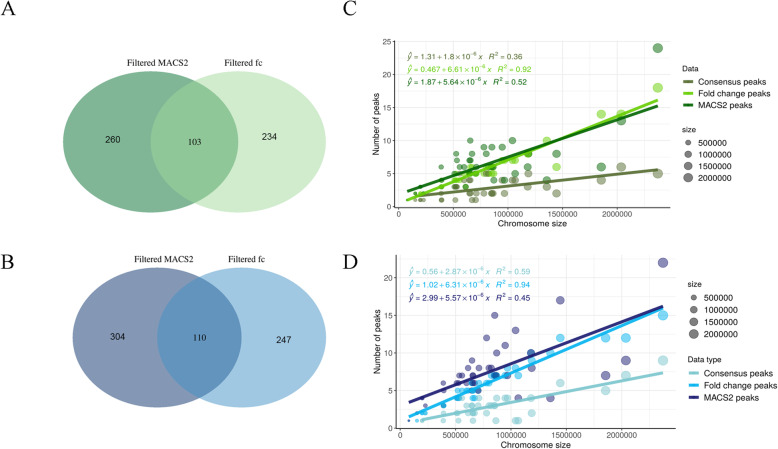
Fig. 2.
Mapping the number of replication origins in T. cruzi genome. Peaks determination was obtained using the MFA-seq data based on the number of reads (fold change) along the genome of cells in replicative and non-replicative phases (ratio S/G2) (fold change - fc) or determined by using the MACS2 software. The Venn diagram shows the number of peaks detected on the two CL Brener haplotypes Esmeraldo-like (a) and Non-Esmeraldo-like (b), according to the type of analysis cited above. The intersection between them corresponds to the consensus of the peaks, which have been determined as origins of replication. The number of peaks detected in all analyses was compared with the size of each chromosome in Esmeraldo like (c) and in Non-Esmeraldo-like (d). A trendline was plotted to facilitate visualization. Values of R2 are shown

