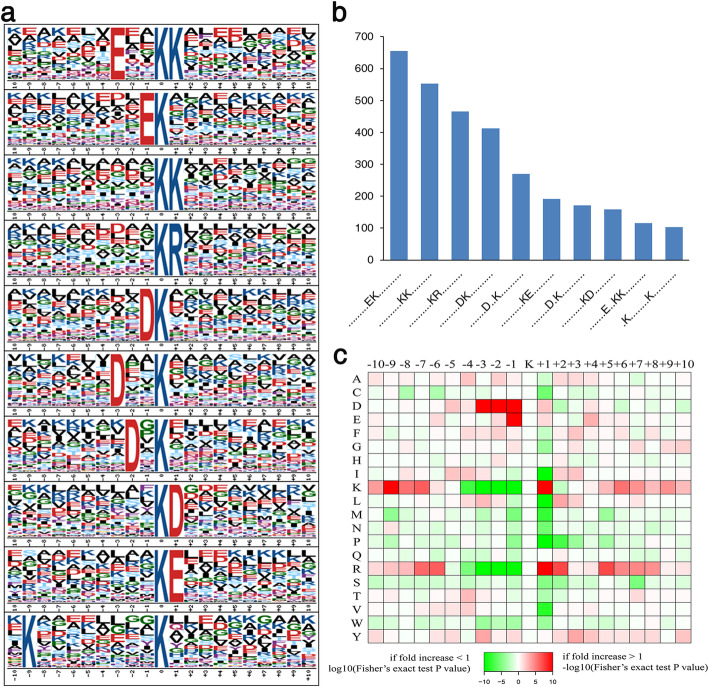
Fig. 2.
Motif analysis of all identified Khib sites. a Conserved motifs identified around the Khib sites. The size of each letter reflects the frequency of that amino acid residue in that position. b Frequency for each motif occurring in peptides with Khib modification. c Heat-map of the amino acid compositions of the Khib sites, showing the enrichment (red) and depletion (green) of amino acids in each position (from − 10 to + 10) flanking the Khib sites

