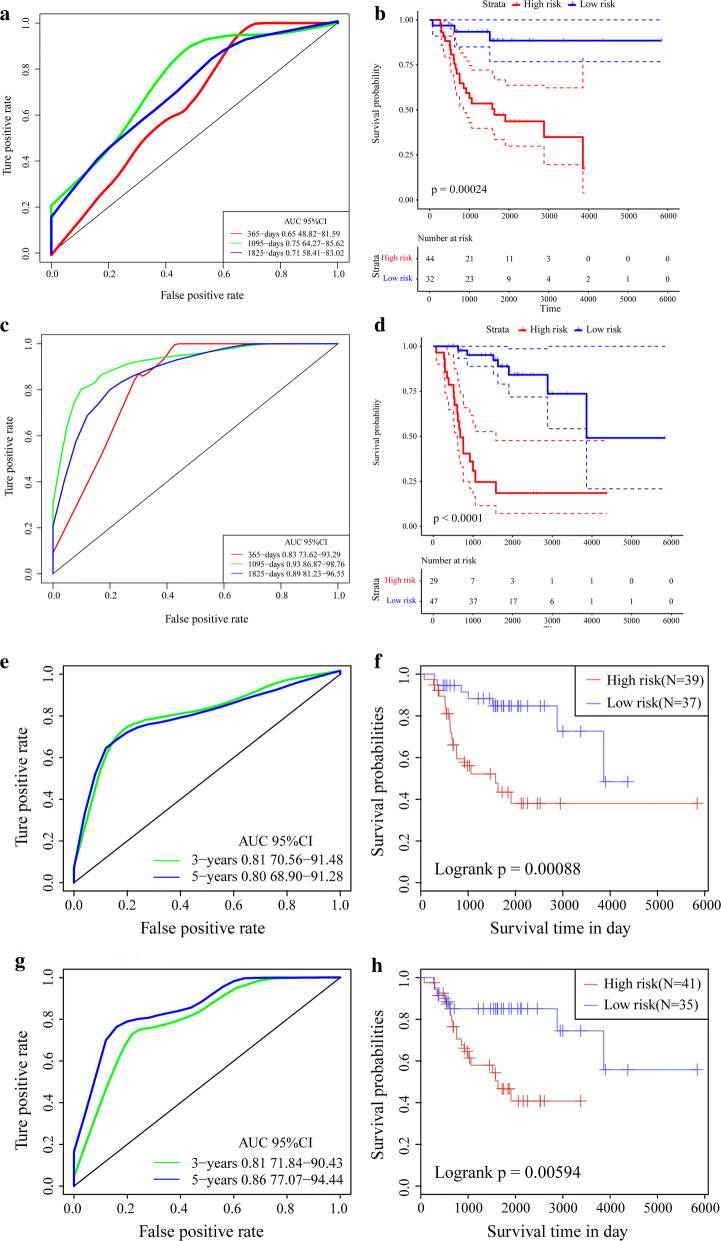
Fig. 12.
Comparative analysis of other models. a AUC curve of eight-gene signature (PMID: 31333788) in TARGET training dataset. b K–M curve of eight-gene signature (PMID: 31333788) in TARGET training dataset. c AUC curve of four-pseudogene signature (PMID: 31146489) in TARGET training dataset. d K–M curve of four-pseudogene signature (PMID: 31146489) in TARGET training dataset. e AUC curve of ten-gene signature (PMID: 31090103) in TARGET training dataset. f K–M curve of ten-gene signature (PMID: 31090103) in TARGET training dataset. g AUC curve of nineteen-pseudogene signature (PMID: 30604867) in TARGET training dataset. h K–M curve of 19-pseudogene signature (PMID: 30604867) in TARGET training dataset

