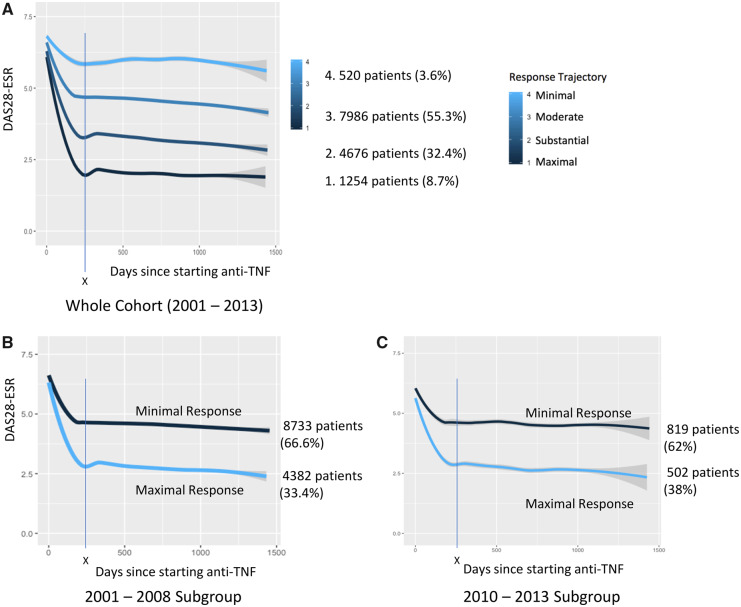
Fig. 1.
Illustrative trajectory plots of response to anti-TNF over time for two- and four-class trajectory models
(A) The four-class model had the lowest BIC for the overall dataset and is shown here. The two-class model was most stable for the 2010–2013 subgroup. To allow comparison between 2001–2008 and 2010–2013 subgroups, the two-class graphical illustrations are shown in (B) and (C). X: maximal response is seen in all trajectories by 250 days. Grey shading represents 95% CI.

