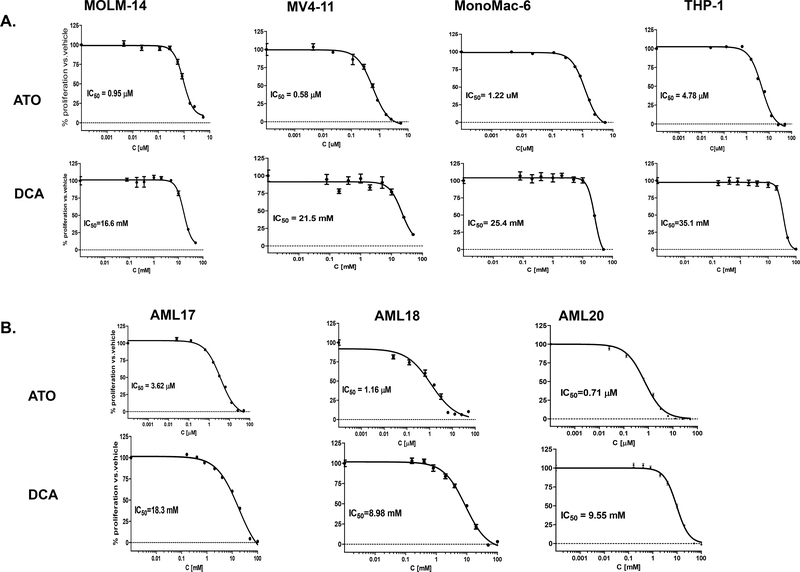
Figure 1. AML cell lines and primary cells with or without FLT3-ITD mutation are sensitive to ATO and DCA treatment.
MOLM-14, MV4–11, MonoMac6 and THP-1 cells as well as AML17, AML18, AML20 cells were exposed to a range of ATO and DCA concentrations as described in Methods and Materials with approximate IC50 range of 0.5–5 μM for ATO and 9–35 mM for DCA. Cells were cultured in presence of drugs for 72 h (48 h for primary cells) and terminated by addition of WST-1 reagent. The representative growth inhibition curves for each cell are shown in this Figure. Error bars represent standard error of mean of triplicate wells. The mean ± standard deviation of IC50 values are shown in Table 1.

