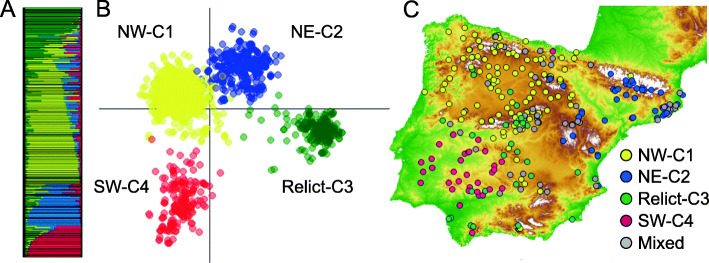
Fig. 3.
Genetic structure of the 278 Arabidopsis thaliana populations of study across the Iberian Peninsula depicting the four genetic clusters (NW-C1, NE-C2, relict-C3 and SW-C4). a Results from the Bayesian clustering method implemented in STRUCTURE. b Results from the Discriminant Analysis of Principal Components (DAPC). c Geographic distribution of homogeneous populations from each genetic cluster. Homogeneous populations (N = 230) were those with average membership proportions among individuals within populations greater than 0.3 for only one genetic cluster. Mixed or heterogeneous populations (N = 48) are also shown in grey. The map of Fig. 3c was obtained from the National Center for Geographic Information (CNIG) of Spain

