Fig. 3.
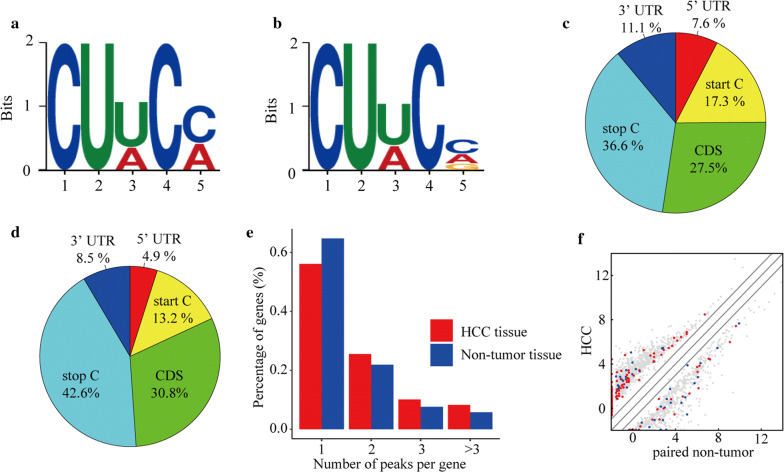
The characteristics of m5C peaks and the joint analysis of methylation and transcriptome. a Motif with minimum E-value of m5C in the hepatocellular carcinoma (HCC) group. b Motif with minimum E-value of m5C in the adjacent tissues group. These two motifs are only slightly different at the last base. c, d Pie chart of m5C peaks in different regions of mRNA. e The number of m5C peaks in HCC and adjacent tissues on each mRNA. Most mRNAs have only one methylation peak. f Scatter plot of the relationship between gene expression level and methylation level. The Y-axis and X-axis represent the expression levels of mRNAs in HCC and paired non-tumor tissues, red dots represent mRNAs with a high methylation level, blue dots represent low methylation horizontal mRNAs, and gray represents no significant difference

