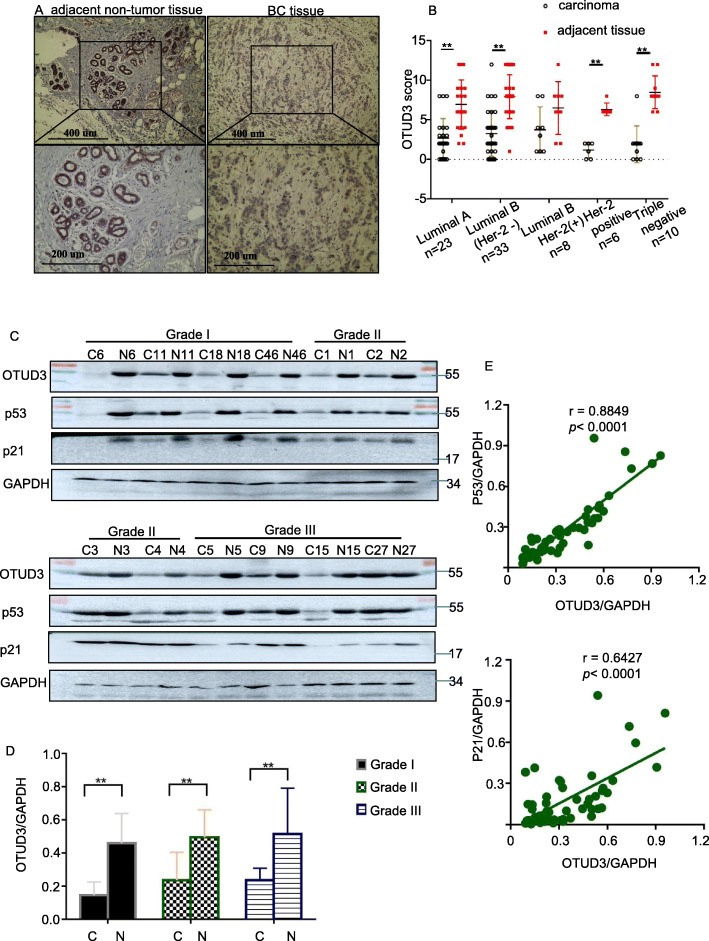
Fig. 2.
OTUD3 expression is decreased in breast cancer tissues. a Representative IHC staining images of OTUD3 in BC tissues and normal breast tissues. The magnifications of the upper and lower images are 100× and 200×, respectively. b OTUD3 staining was assessed, calculated, plotted and analyzed. **p < 0.01 (Chi-square test). c WB results of 12 pairs of fresh tissues samples. d OTUD3 expression was independent of the histological grade. e Positive correlations were identified among OTUD3, p53 and p21 expression in breast cancer tissues. C, breast cancer tissue; N, matched normal tissue

