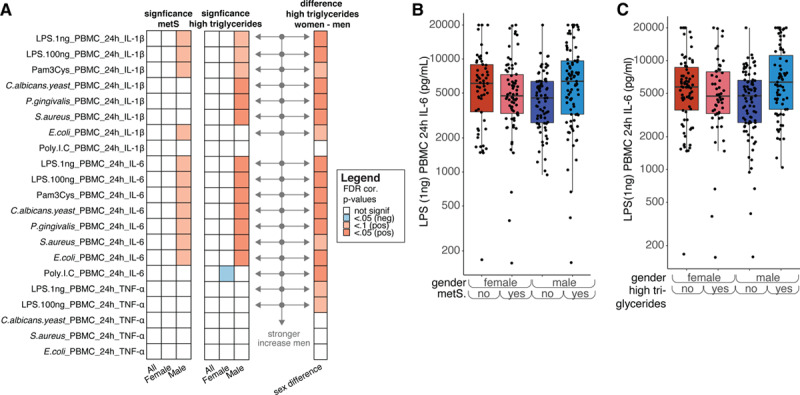
Figure 4.

A, Left, same as (A) but for IL (interleukin)-6, IL-1β, and TNFα production in peripheral blood mononuclear cells (PBMCs) after different stimulations. Middle, similar to the heatmap on the left but for high triglycerides instead of metabolic syndrome (right) similar to (D) but solely plotted for high triglycerides (false discovery rate [FDR] corrected). The arrows mark those cytokines after stimulation that show a significantly stronger increase in men than in women. Note: if men show a nonsignificant difference between men with and without MetS and women also show a nonsignificant difference, the increase in men show with getting MetS can still be significantly different from the change that women show. B, Example plot showing the effect of metabolic syndrome and sex on IL-6 production in response to Candida albicans stimulation. C, Example plot showing the effect of having high triglycerides and sex on IL-6 production in response to C albicans stimulation. Note: P values were calculated in a similar fashion as for Figure 3.
