
Figure 2a-2d.
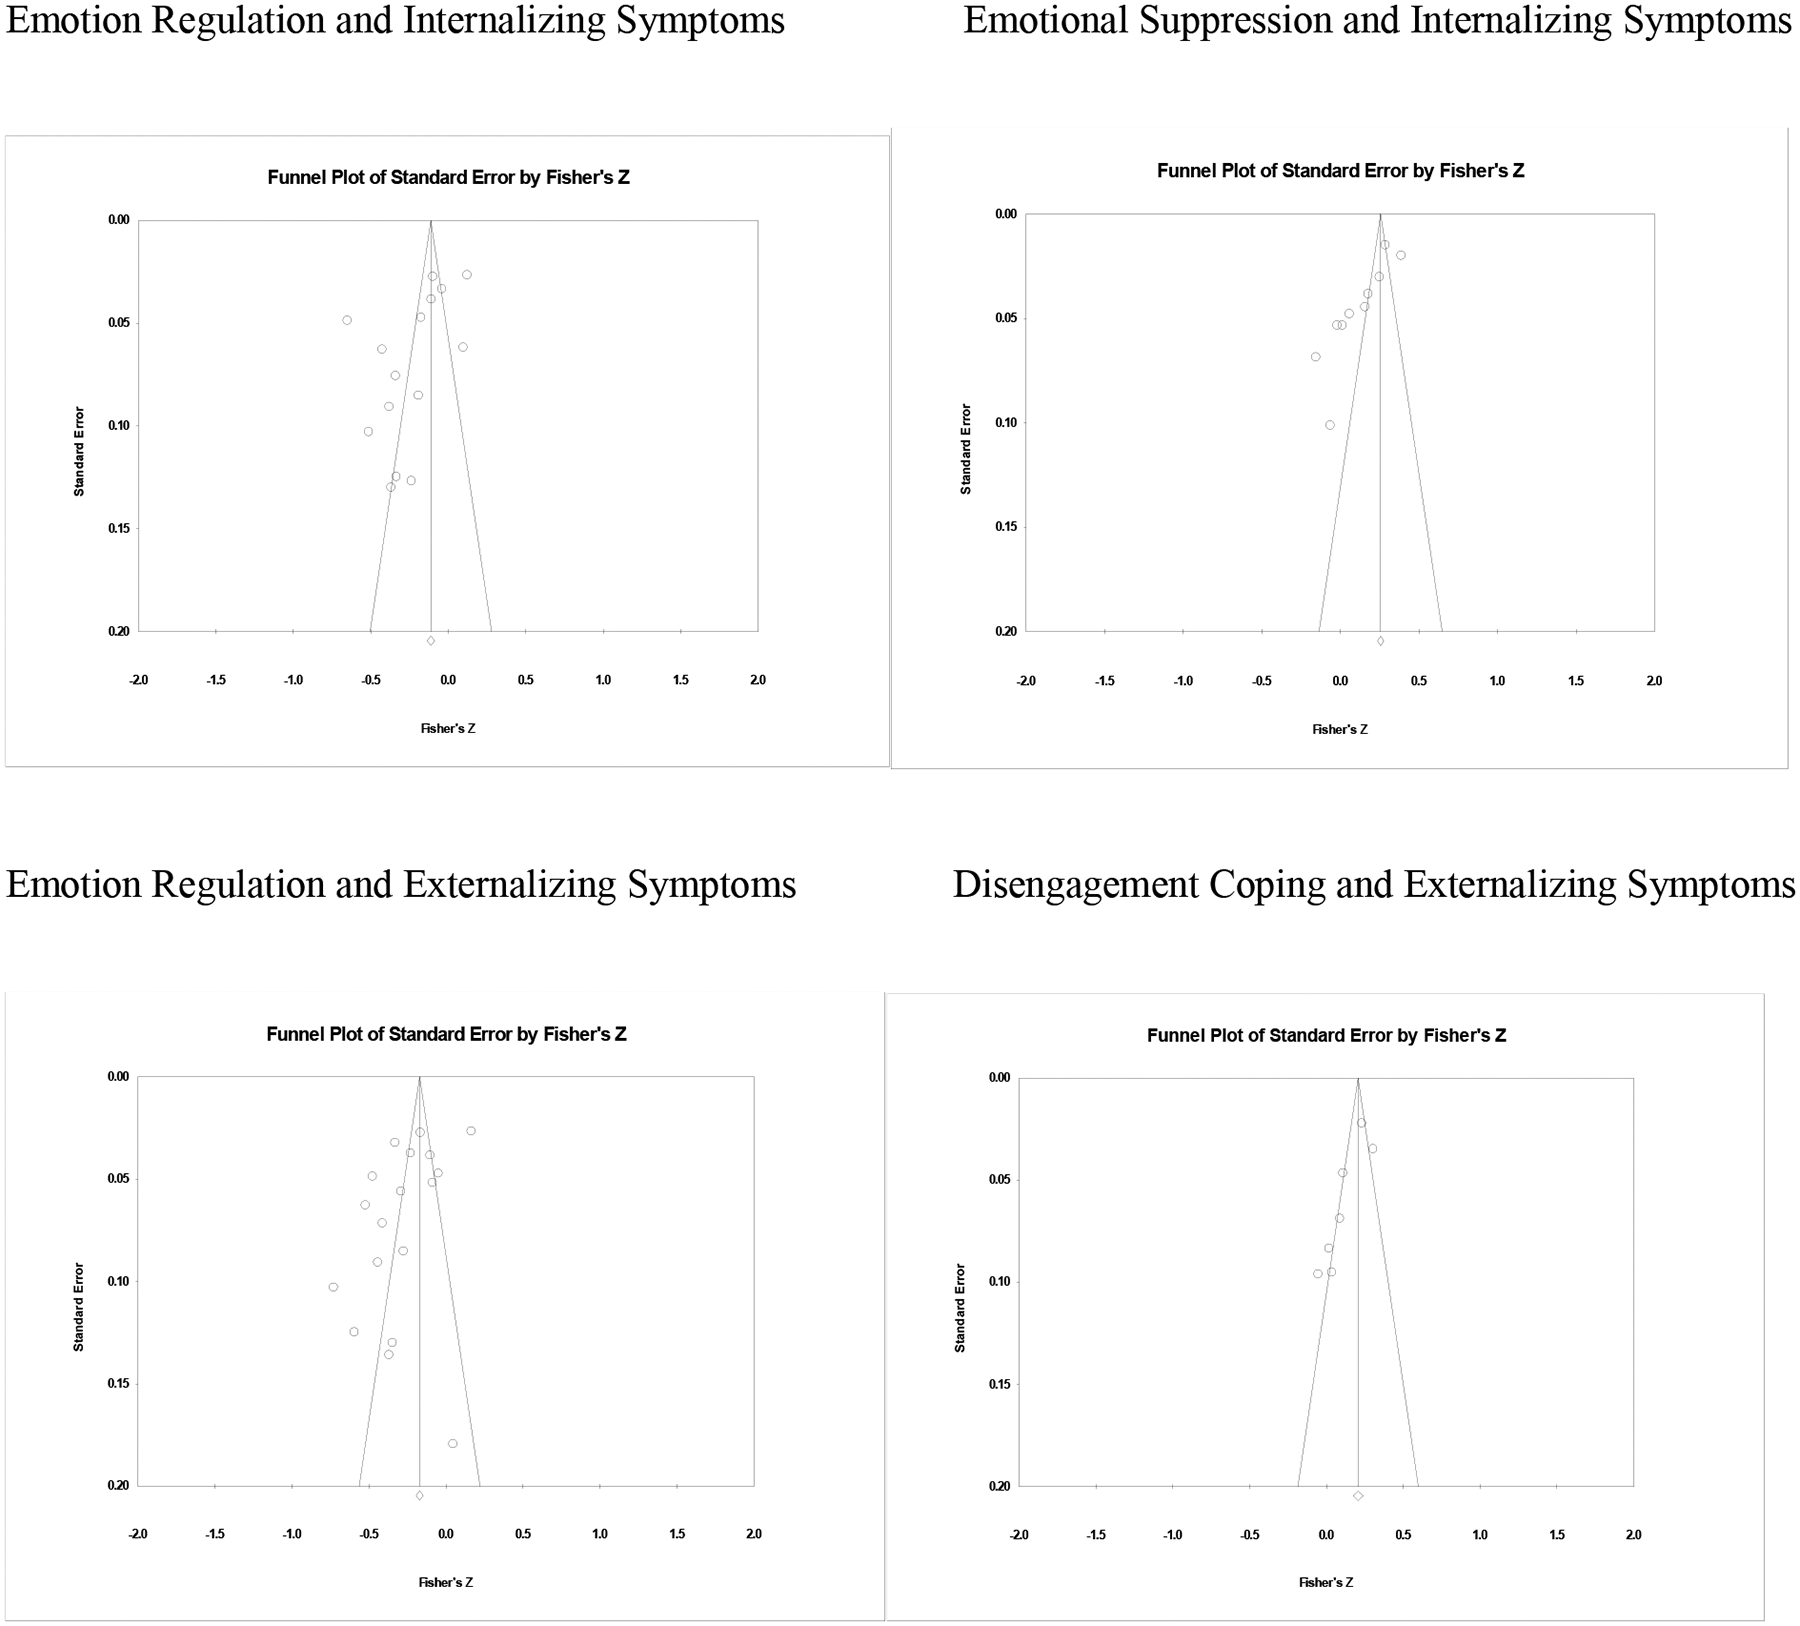
Funnel plots for the relationship between the standard error and Fisher’s Z in cross-sectional studies of coping and emotion regulation and symptoms of psychopathology.
Official websites use .gov
A
.gov website belongs to an official
government organization in the United States.
Secure .gov websites use HTTPS
A lock (
) or https:// means you've safely
connected to the .gov website. Share sensitive
information only on official, secure websites.
Funnel plots for the relationship between the standard error and Fisher’s Z in cross-sectional studies of coping and emotion regulation and symptoms of psychopathology.