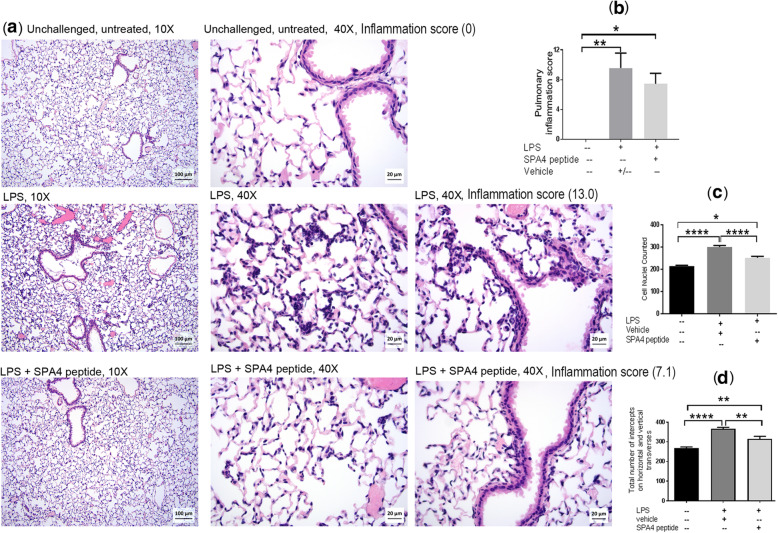
Fig. 8.
Assessment of inflammation in H&E-stained lung tissue sections of LPS-challenged and SPA4 peptide-treated C57BL6 mice. Representative photomicrographs of H&E-stained lung tissue sections of mice included in five separate experiments. The photomicrographs were taken using a 10X and 40X objective (a). Low and high magnification photomicrographs demonstrate differences in the semi-quantitative grading criteria, including the extent of peribronchial/bronchiolar infiltrates, severity of peribronchial/bronchiolar infiltrates, extent of alveolar infiltrates, and severity of alveolar septal and luminal neutrophilic infiltrates. The pulmonary inflammation scores (Mean + SEM) for mice in each group are shown as bar chart (b). Inflammation scores for individual representative images are indicated within (a). The number of cell nuclei counted in five randomly selected regions per lung tissue section (c). Total number of intercepts counted on horizontal and vertical transverses in five randomly selected regions per lung tissue section. The cell nuclei and number of intercepts were counted using the STEPanizer program (d). Mean + SEM values are shown within each figure for different types of measurements of lung inflammation. The p values (* p < 0.05, ** p < 0.005, **** p < 0.0001) were determined by ANOVA with Tukey’s post-hoc analysis

