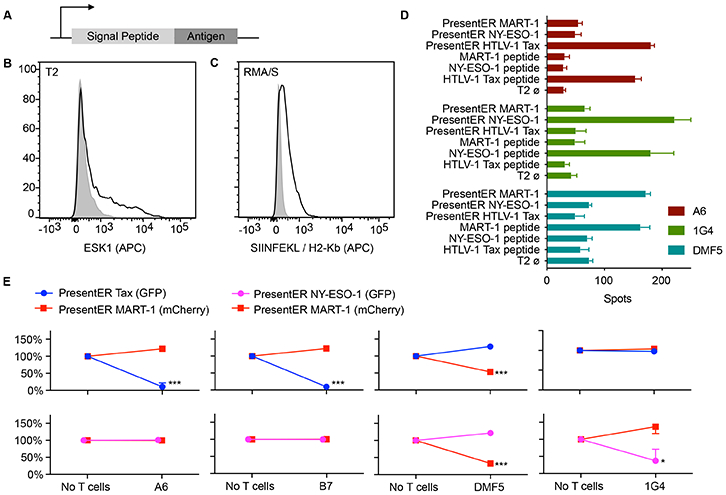
Fig. 1: Design and characterization of PresentER minigene.

(A) The PresentER minigene encodes an ER signal sequence, followed by a peptide antigen and a stop codon. (B) T2 cells expressing PresentER-RMFPNAPYL (black) but not PresentER-ALYVDSLFFL (gray) bind ESK1, a TCR mimic antibody to the complex of RMFPNAPYL/HLA-A*02:01. (C) An antibody to SIINFEKL/H-2Kb binds to RMA/S cells expressing PresentER-SIINFEKL (black), but not to PresentER-MSIIFFLPL (gray). (D) ELISpot of genetically engineered T cells expressing the A6 (target: HTLV-1 Tax:11-19 LLFGYPVYV), DMF5 (target: MART-1:27-35 AAGIGILTV) or 1G4 (target: NY-ESO-1:157-165 SLLMWITQC) TCRs challenged with peptide-pulsed T2 cells or T2 cells expressing PresentER minigenes (3 replicates per condition). Error bars indicate SEM. (E) Results of in vitro co-culture killing assays where A6, B7, DMF5 and 1G4 expressing T cells were incubated with a mixture of T2 cells expressing PresentER-Tax (GFP)/PresentER MART-1 (mCherry), PresentER NY-ESO-1 (GFP)/PresentER MART-1 (mCherry). The change in abundance of the T2 target cells are plotted relative to their abundance in the “No T cells” sample. Each point is the average of 3 replicates. Error bars indicate SEM. Two-tailed t-tests comparing the abundance of each target at the beginning and end of the experiment are designated as *p ≤ 0.05, **p ≤ 0.01, ***p ≤0.001.
