
Fig. 4: Discovery of off-targets of the ESK1 TCR mimic antibody.
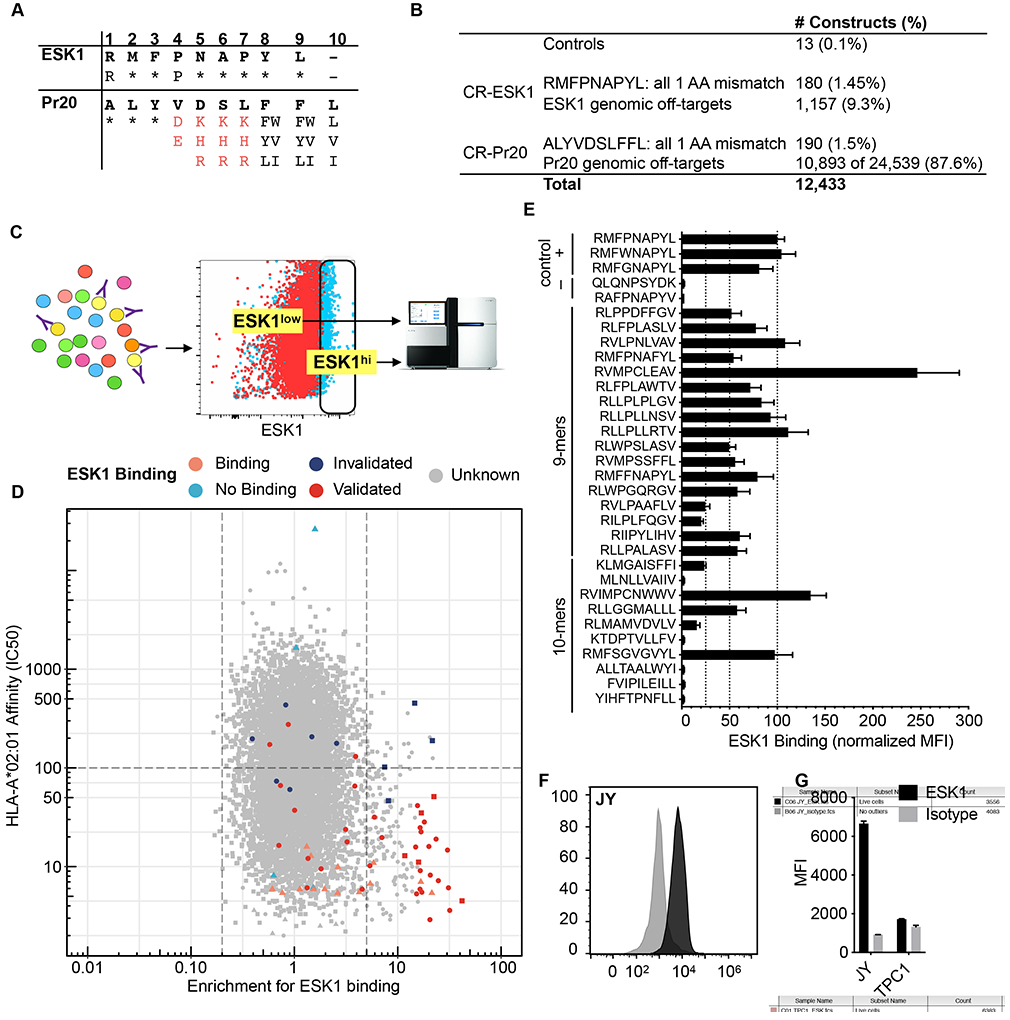
(A) The motif used to search the human proteome for peptides that might bind to ESK1 and Pr20. Asterisks indicate that any amino acid is allowed. Red characters indicate prohibited amino acids and black characters indicate allowed amino acids at that position. (B) Description of the constructed library. (C) Schematic of the flow-based screen. T2s are transduced at low MOI with retrovirus encoding a pool of PresentER minigenes, selected with puromycin and stained with the TCR mimic antibodies. Fluorescent activated cell sorting (FACS) is used to sort antibody binding and non-binding populations for sequencing. (D) Scatterplot of the ESK1 library screen. Each point is a unique peptide minigene plotted as minigene enrichment for ESK1 binding (x-axis; with 1 set as no enrichment; average of two replicates) vs. predicted ic50 (in nM) to HLA-A*02:01 (y-axis). Lower ic50 indicates higher affinity. Control peptides and known ESK1 targets are plotted as triangles; CR-ESK1 as circles and CR-Pr20 as squares. Peptides that validated by peptide pulsing are displayed in dark red. Peptides that did not validate by peptide pulsing are in dark blue. Control ESK1 binders are in orange and control non-binders are in teal. Unknown binding is in gray. (E) 27 peptides that were highly enriched for ESK1 binding and had high predicted affinity to HLA-A*02:01 (from Figure D) were synthesized at microgram scale, pulsed onto T2 cells in triplicate and stained with ESK1. Previously identified cross-reactive targets were included as positive controls. The median fluorescence intensity of ESK1 binding is plotted, normalized to RMFPNAPYL (set at 100 units). Error bars indicate SEM. (F) Representative ESK1 and isotype staining of the JY cell line. (G) Quantification of ESK1 and isotype staining of the JY and TPC1 cell lines in triplicate. Error bars indicate SEM.