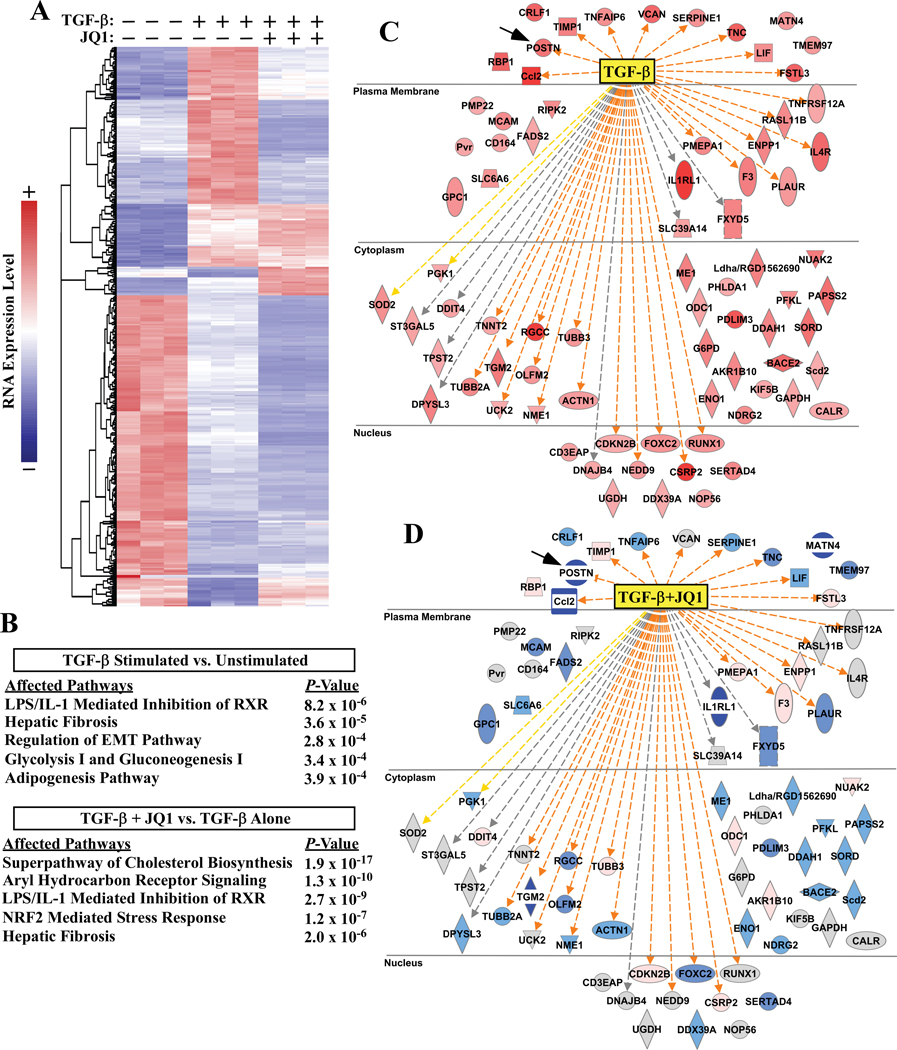
Figure 2. JQ1 globally suppresses pro-fibrotic gene expression in cardiac fibroblasts.
ARVFs were treated with TGF-β1 in the absence or presence of JQ1 or vehicle control (DMSO) for 24 hours prior to extraction of RNA for RNA-seq analysis. A, Heat map of genes significantly altered by TGF-β1. Each column represents data from a distinct plate of cells. Color indicates row-normalized expression from +2 (red) to −2 (blue). B, Ingenuity pathway analysis (IPA) was used to determine canonical pathways significantly altered by TGF-β stimulation relative to vehicle control or versus TGF-β + JQ1 treatment. The top five affected pathways for each analysis are reported; three redundant cholesterol biosynthesis pathways were removed from the lower table. C, IPA analysis also indicated TGF-β as the strongest upstream effector molecule in the dataset. Induced genes that led to this determination are displayed (red indicates increased expression following TGF-β treatment). D, Comparison of expression of these same genes in TGF-β-treated versus TGF-β + JQ1 treated cells revealed that JQ1 blocked induction of the majority of TGF-β downstream target genes (blue indicates decreased expression following JQ1 treatment, grey indicates no significant change). Connecting lines in C and D represent IPA prediction of direct TGF-β effects on gene expression in the TGF-β vs unstimulated analysis (C); orange = predicted and measured activation, grey = predicted effect without predicted directionality, and yellow = predicted effect opposite of measured effect in the dataset. Shape key:  =cytokine,
  =enzyme,
  =G-protein couple receptor,
 =kinase,
 =peptidase,
  =transcription regulator,
  =transporter,
  =transmembrane receptor,
  =other.

