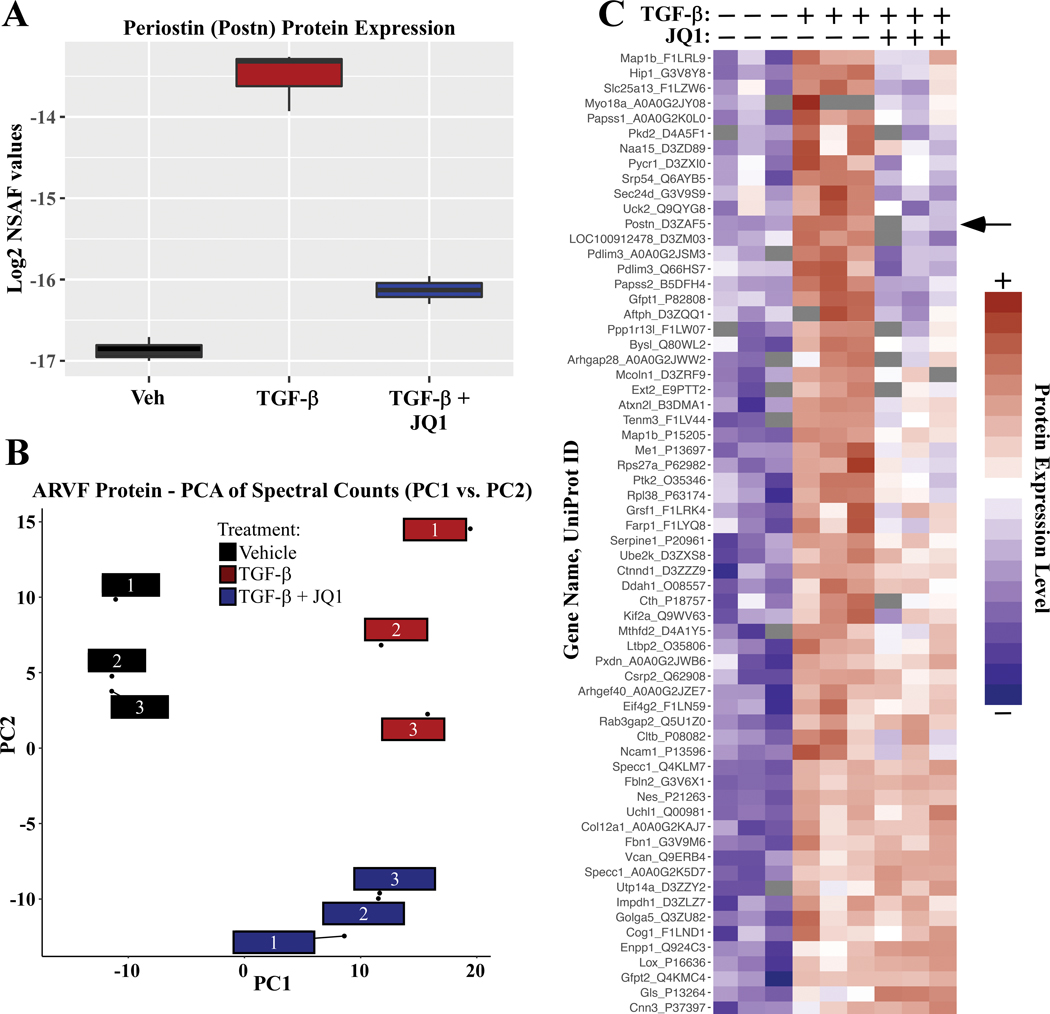
Figure 3. JQ1 suppresses TGF-β-induced expression of protein markers of cardiac fibroblast activation.
ARVFs were treated with DMSO vehicle or TGF-β in the absence or presence of JQ1 for 48 hours. Total protein was subjected to LC-MS analysis, as described in the Methods section. A, Label-free quantification of Periostin protein expression. Box: interquartile range; whiskers: min to max, with n=3 plates of cells per condition; Normalized Spectral Abundance Factor (NSAF). B, Principal component analysis of relative protein abundance revealed clear segregation of each treatment group. Each box represents data from an independent plate of ARVFs. C, Heat map of standardized protein values depicts proteins that were increased in expression upon TGF-β stimulation, and impact of JQ1 treatment on this induction (Benjamini & Hochberg adjusted P-value <0.1). Color indicates row-normalized expression from +2 (red) to −2 (blue).

