
Fig. 1.
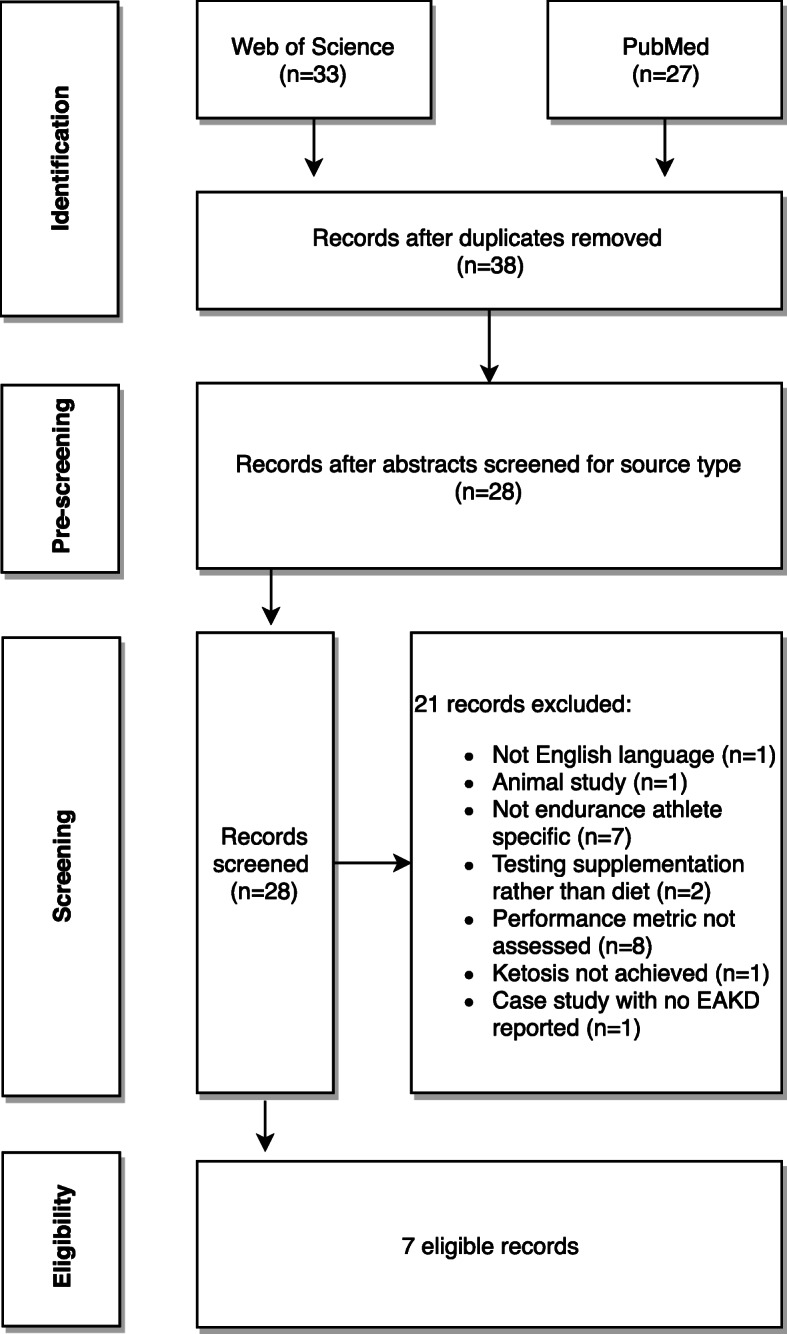
Flow chart depicting the literature search and review process to arrive at the final analytic sample (n = 7). Arrows pointing right indicate the number of articles excluded and for what reason
Official websites use .gov
A
.gov website belongs to an official
government organization in the United States.
Secure .gov websites use HTTPS
A lock (
) or https:// means you've safely
connected to the .gov website. Share sensitive
information only on official, secure websites.
Flow chart depicting the literature search and review process to arrive at the final analytic sample (n = 7). Arrows pointing right indicate the number of articles excluded and for what reason