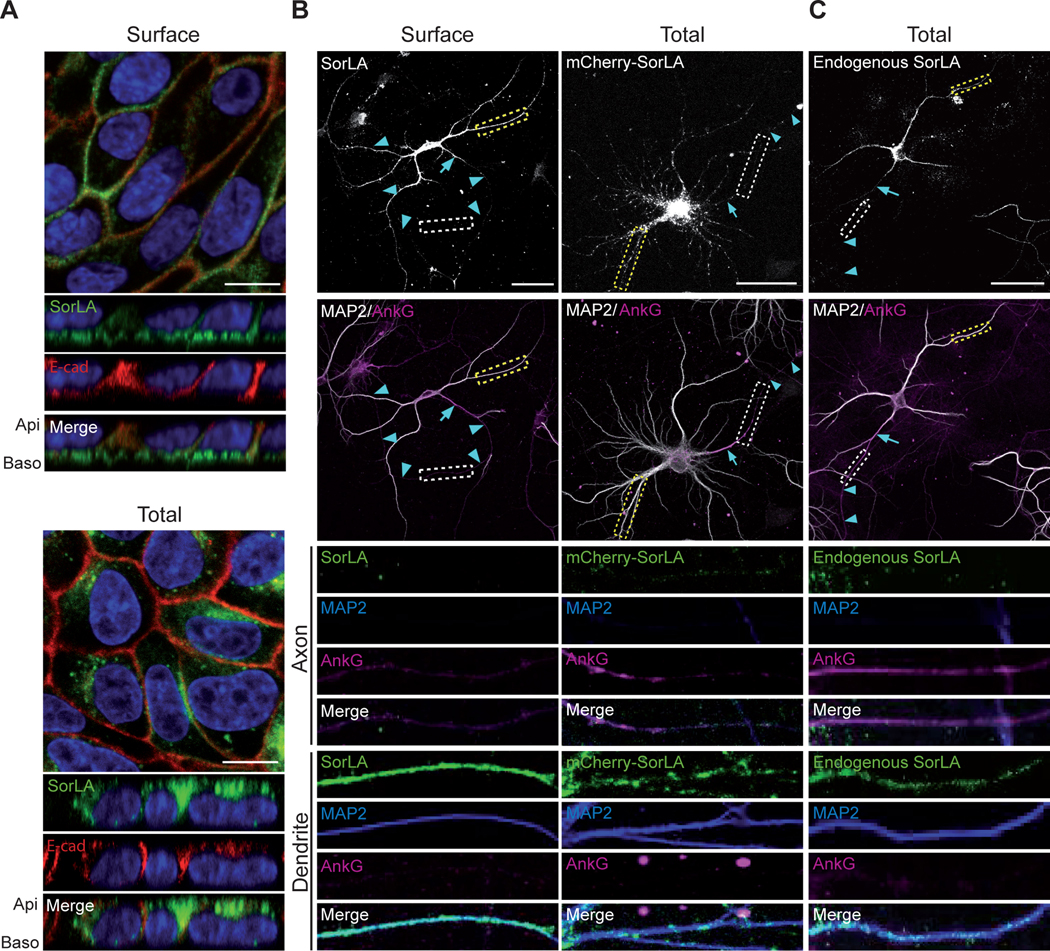
FIGURE 1. Polarization of SorLA in epithelial cells and rat hippocampal neurons.

A) The localization of full-length SorLA (green) visualized by immunohistochemical staining in polarized and stably transfected MDCK CCL34 cells. The upper panel shows the surface-associated fraction, while the lower panel shows a total staining. E-cad (red) marks the basolateral membrane. The images are from the middle of a z-stack, and images of the xz-dimension are shown below. B) The localization of full-length or mCherry-tagged SorLA tail in hippocampal rat neurons at DIV 10. The left panel shows the surface-staining of full-length SorLA, while the right panel shows a total staining of mCherry-SorLA. C) Total staining of endogenous SorLA, using a monoclonal antibody (anti-LR11). White and yellow boxes frame segments of the axon and a dendrite, respectively, and enlargements are shown below. MAP2 is used to identify dendrites and AnkG to identify the axon. Arrow: axon initial segment. Arrowheads: axon. Scalebars: 10 μm for MDCK cells and 50 μm for neurons. The close-ups of axons in B and C are rotated to align the part of the axon branching from the soma at the left side.
