Fig. 2.
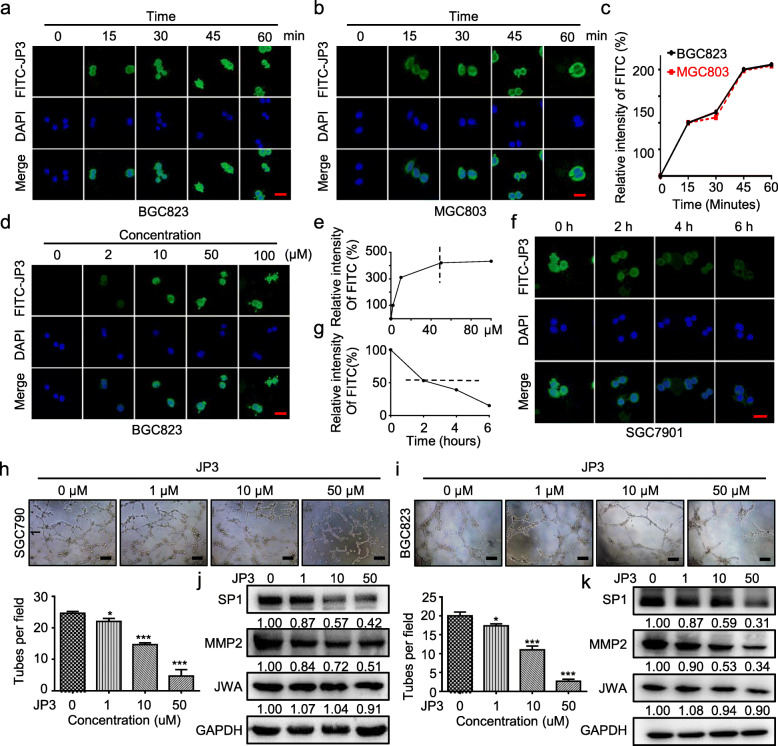
JP3 inhibits GC cells mediated tubular formation of HUVECs in vitro. a-b The subcellular localization and fluorescence intensity of BGC823 (a) and MGC803 (b) cells treated with FITC-JP3 for indicated time were determined by confocal laser scanning microscopy (scale bars = 50 μm). c The relative intensity of FITC fluorescence in MGC803 (red) and BGC823 (black) cells at different time points. d Representative images of SGC7901 cells treated with FITC-JP3 for 45 min (scale bars = 50 μm). e The relative intensity of FITC fluorescence in SGC7901 cells with different concentrations. f SGC7901 cells were treated with FITC-JP3 (50 μM) for 45 min, washed with PBS three times and cultured in normal medium. The cells were fixed for 0, 2, 4 and 6 h respectively (scale bars = 50 μm). g The half-life curve of FITC-JP3 was drawn. h-i Tube formation assay in HUVECs cultured with the medium collected from SGC7901 (h) and BGC823 (i) cells. Tubes were imaged (scale bars = 200 μm), and tube formation was quantified. j-k The indicated protein levels in SGC7901 (j) and BGC823 (k) were determined by Western blotting. The data are presented as the means ± SEM, ns: no significance, *P < 0.05, **P < 0.01

