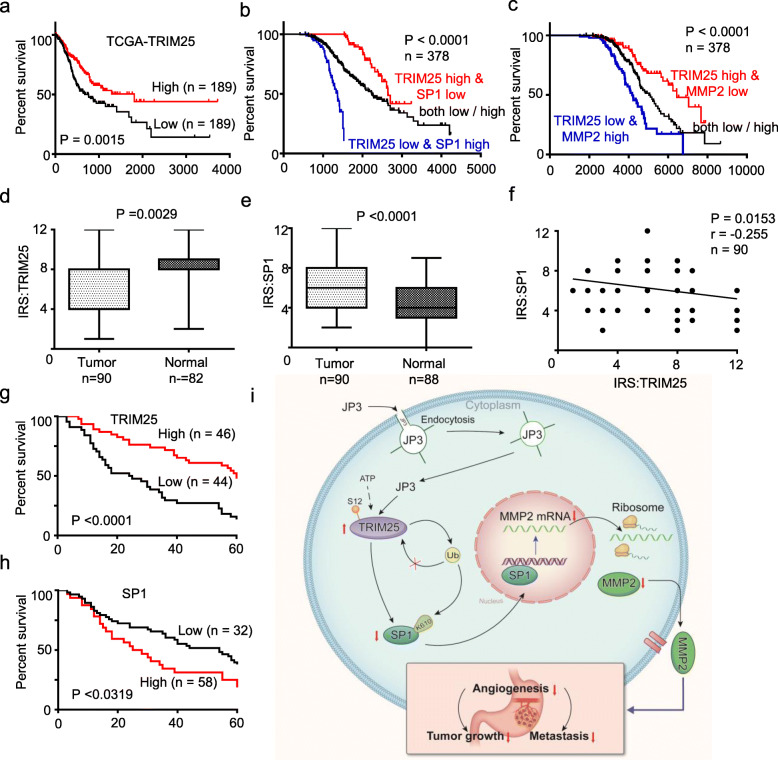
Fig. 6.
Dysregulation of the TRIM25-SP1-MMP2 axis in GC. a-c Kaplan–Meier Overall Survival curves of human GC patients with low versus high TRIM25 (a), combined with TRIM25/SP1 (b) and combined with TRIM25/MMP2 (c) expressions, based on TCGA data (http://www.oncolnc.org/). d-e Protein levels of TRIM25 and SP1 were detected in GC tumor tissues and normal tissues by IHC. f The correlations of the TRIM25 protein levels and SP1 protein levels were calculated (n = 90). g-h Kaplan-Meier curves depicting OS according to the expression patterns of TRIM25 (g) and SP1 (h) in the GC cohort. P values were calculated with the log-rank test. i A working model of JP3 on inhibiting tumor angiogenesis of CC via activating TRIM25 signaling pathway

