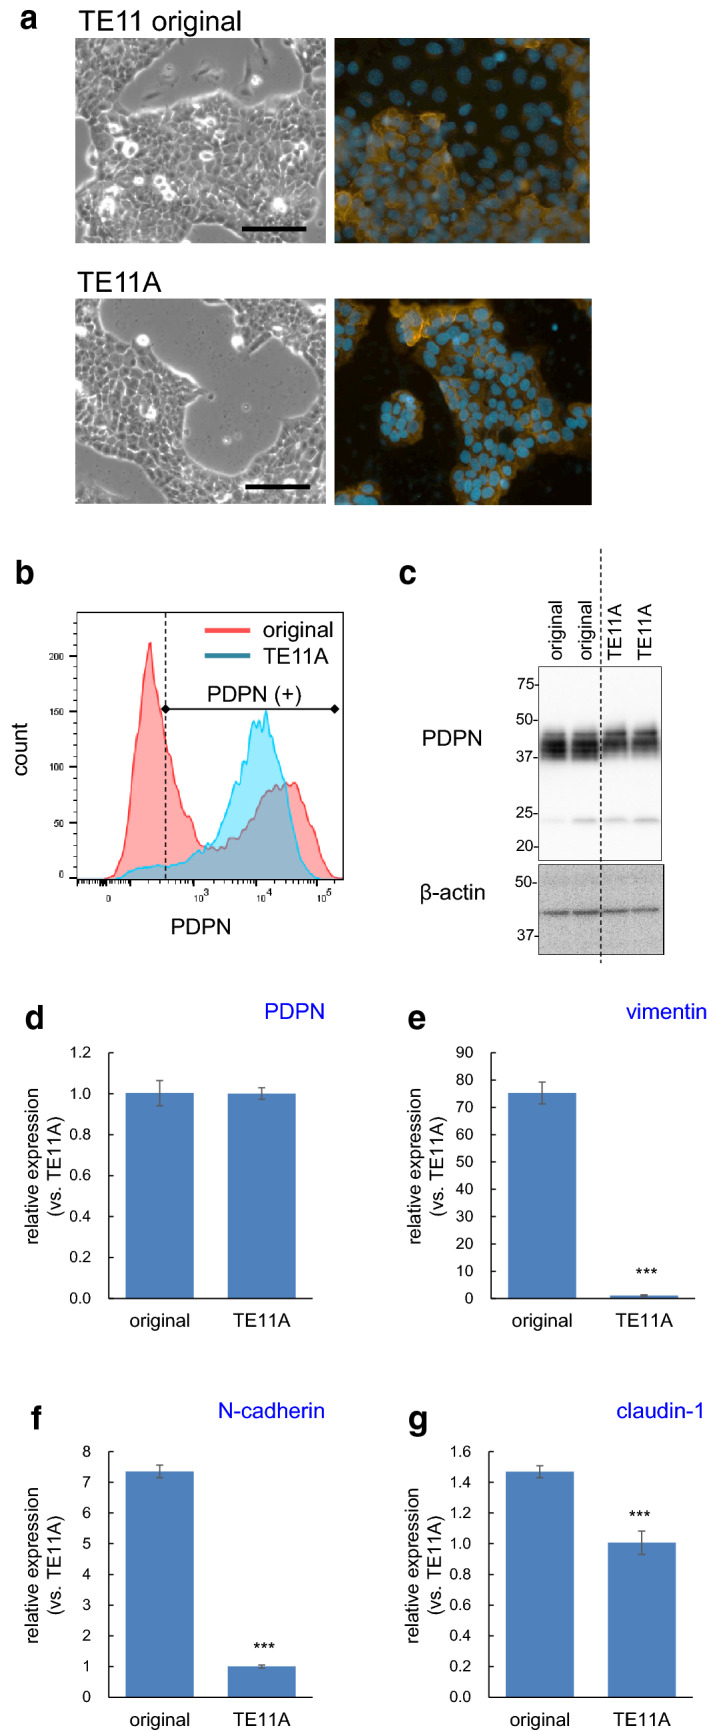
Fig. 1.

Comparison of sub-cloned TE11A and original TE11 cell population. a Proliferation phase morphology of the original TE11 and TE11A cells grown in culture dishes. In TE11 cells, some cells departed from the epithelial cell-like congregates. Scale bar: 100 µm. The right-side images show immunofluorescent staining of PDPN (orange) and nuclei (blue) at the same magnification. b FACS analysis of the cell-surface PDPN expression. The TE11 cell population is shown in red and subcloned TE11A cells in blue. The right side of dotted line represents the PDPN expressing cell population. c Western blot analysis of total PDPN. d–g Real-time PCR analysis of basal PDPN and EMT-related gene expression levels. The expression levels in TE11 cells were expressed relative to those in TE11A cells. The values are mean ± SEM of four culture wells in one representative experiment. ***P < 0.001 vs. original TE11 cells by unpaired Student’s t-test
