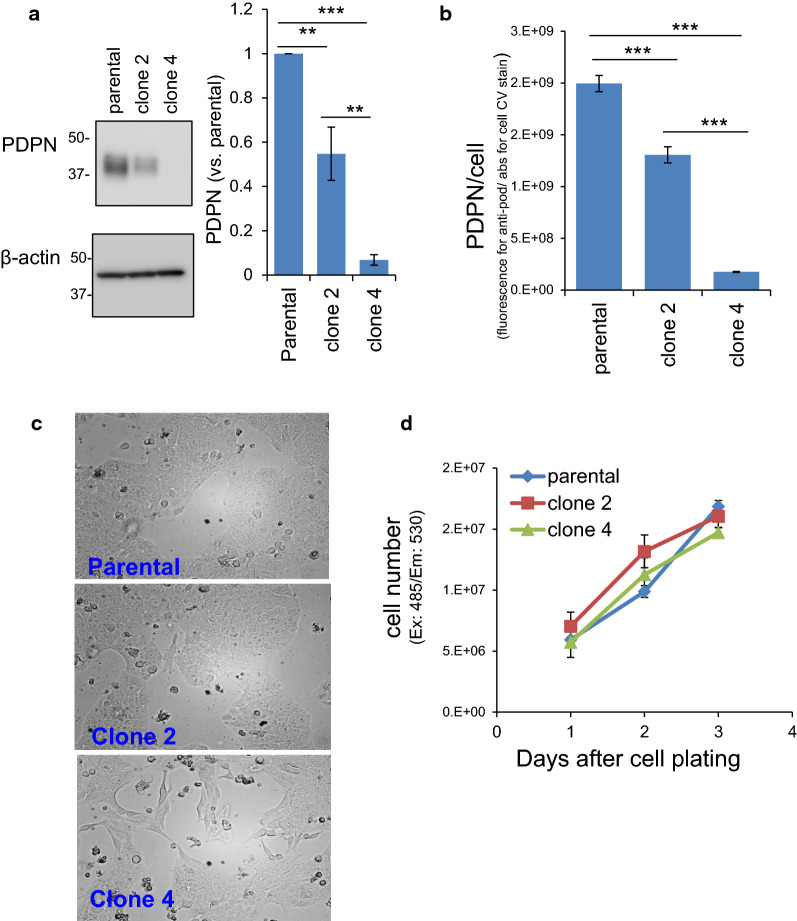
Fig. 4.
Characterization of PDPN knockout TE11A cells. a Western blotting analysis of cellular expression levels of PDPN. The analyses were conducted three times. The densitometric values were normalized to that of parental cells in each assay. Values are expressed as the mean ± SEM. **P < 0.001 and ***P < 0.001 by one-way ANOVA and Tukey’s test. b Cell surface expression level of PDPN, assessed by cell-ELISA. Values are expressed as the mean ± intra-assay deviation expressed as the standard deviation (SD) from 4 wells. *** P < 0.001 by one-way ANOVA and Tukey’s test. c Proliferation phase morphology of parental, clone 2, and clone 4 TE11A cells grown in culture dishes. d Growth rate of clonal cells. Cells were plated in 48-well plates at a density of 2.5 × 10⁴/well. Plates were washed with PBS and frozen on days 1, 2, and 3. After thawing and lysis with 0.5% Triton X-100 in PBS, the nuclei were stained with Cyquant dye and their fluorescence intensity was measured at an excitation and emission wavelength of 485 and 530 nm, respectively. Values are expressed as the mean ± intra-assay deviation expressed as SD for 4 well cultures

