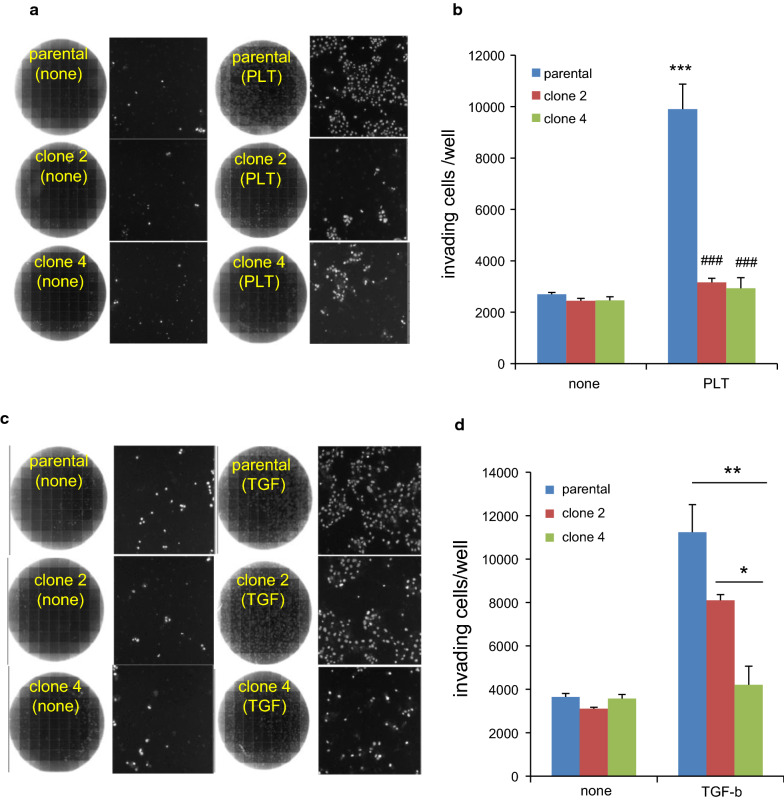
Fig. 8.
Effect of PDPN knockout on invasion ability. a, c Composite image of an entire trans-well (left) from a total of 196 images and one of representative images showing DAPI-stained cells (right). Cells were treated with platelets plus EGTA (A) or TGF-β (C) for 1 day, followed by supplementation with fresh medium and additional culturing for 2 days. On day 3, the cells were harvested and seeded in the upper matrigel chambers with serum-free medium (1.5 × 10⁵). The chambers were then placed in holder wells containing 10% serum-containing medium. Two days after the trans-well culture, the number of invading cells was counted using ArrayScan, as described in the Materials and Methods. b, d Histogram of the number of invading cells for each clone cells with or without EMT induction. In b, the assay was conducted in quadruplicates and the values are expressed as the mean + SEM. **P < 0.001 and ***P < 0.001 vs. non-treated parental cells by one-way ANOVA and Tukey’s test, and ###P < 0.001 vs. parental cells of respective treatment group by two-way ANOVA and Bonferroni’s test. In d, the invasion of non-treated cells was measured in duplicate and the values are expressed mean ± range, while those for TGF-β-treated group triplicates is expressed as the mean ± SEM by one-way ANOVA and Tukey’s test

