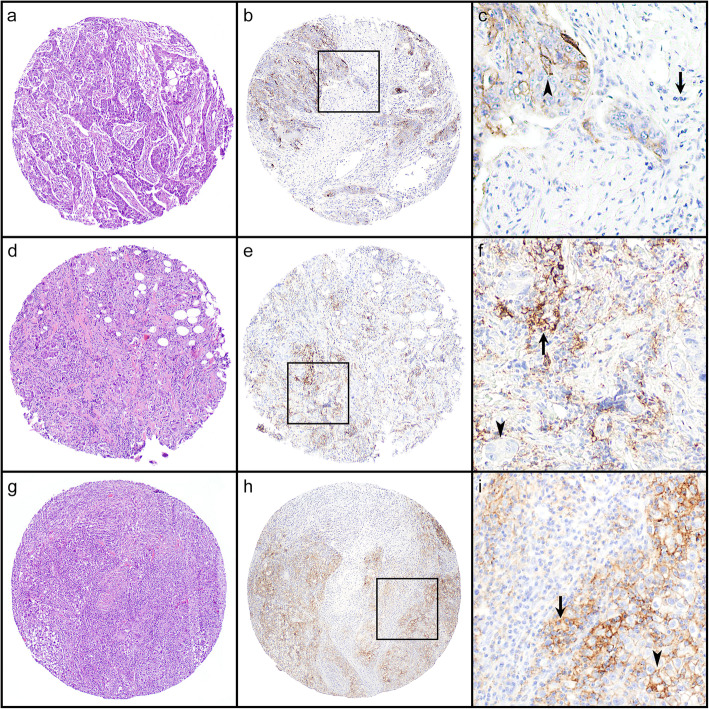
Fig. 2.
Examples of immunohistochemical staining results. a, d, g Hematoxylin and eosin images of the tissue microarray cores. b, e, h Images of PD-L1 staining. c, f, i Magnified images of the boxed areas in b, e, and h. Arrow, tumor-infiltrating immune cells. Arrowhead, tumor cells. The first row (a–c) represents a case with positive staining in the tumor cells and negative staining in the immune cells. The second row (d–f) represents a case with positive staining in the immune cells and negative staining in the tumor cells. The third row (g–i) represents a case with positive staining in both the immune cells and the tumor cells. Original magnification: a, b, d, e, g, h × 40; c, f, i × 100

