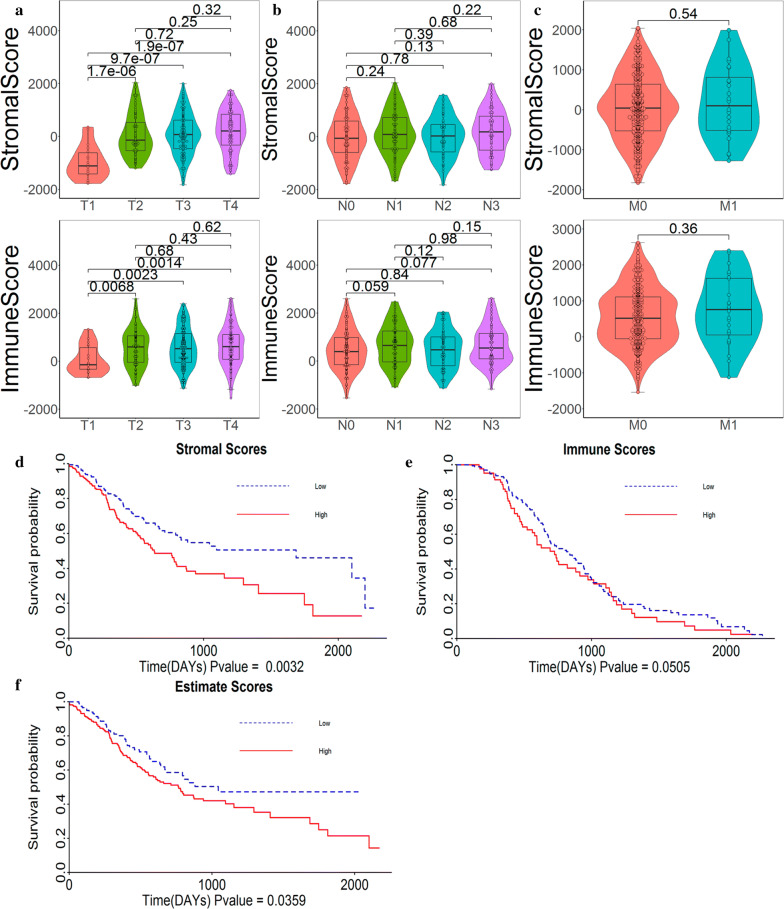
Fig. 1.
Stromal, immune, and estimate score distribution and survival analysis of STAD samples. a Score distribution of T staging. The violin plot shows a correlation between the T stage of STAD and the stromal score level. b Score distribution of N staging. The violin plot showed no significant association between the N stage and stromal/immune scores (p > 0.05). c Score distribution of M staging. The violin plot showed no significant association between the M stage and stromal/immune scores (p = 0.54 and p = 0.36, respectively). d From the survival curve, we can see that the high stromal score is related to the poor overall survival (p = 0.0032). e Similarly, high immune scores are associated with poor overall survival (p = 0.0505). f Estimate score is also related to overall survival (p = 0.0359)

