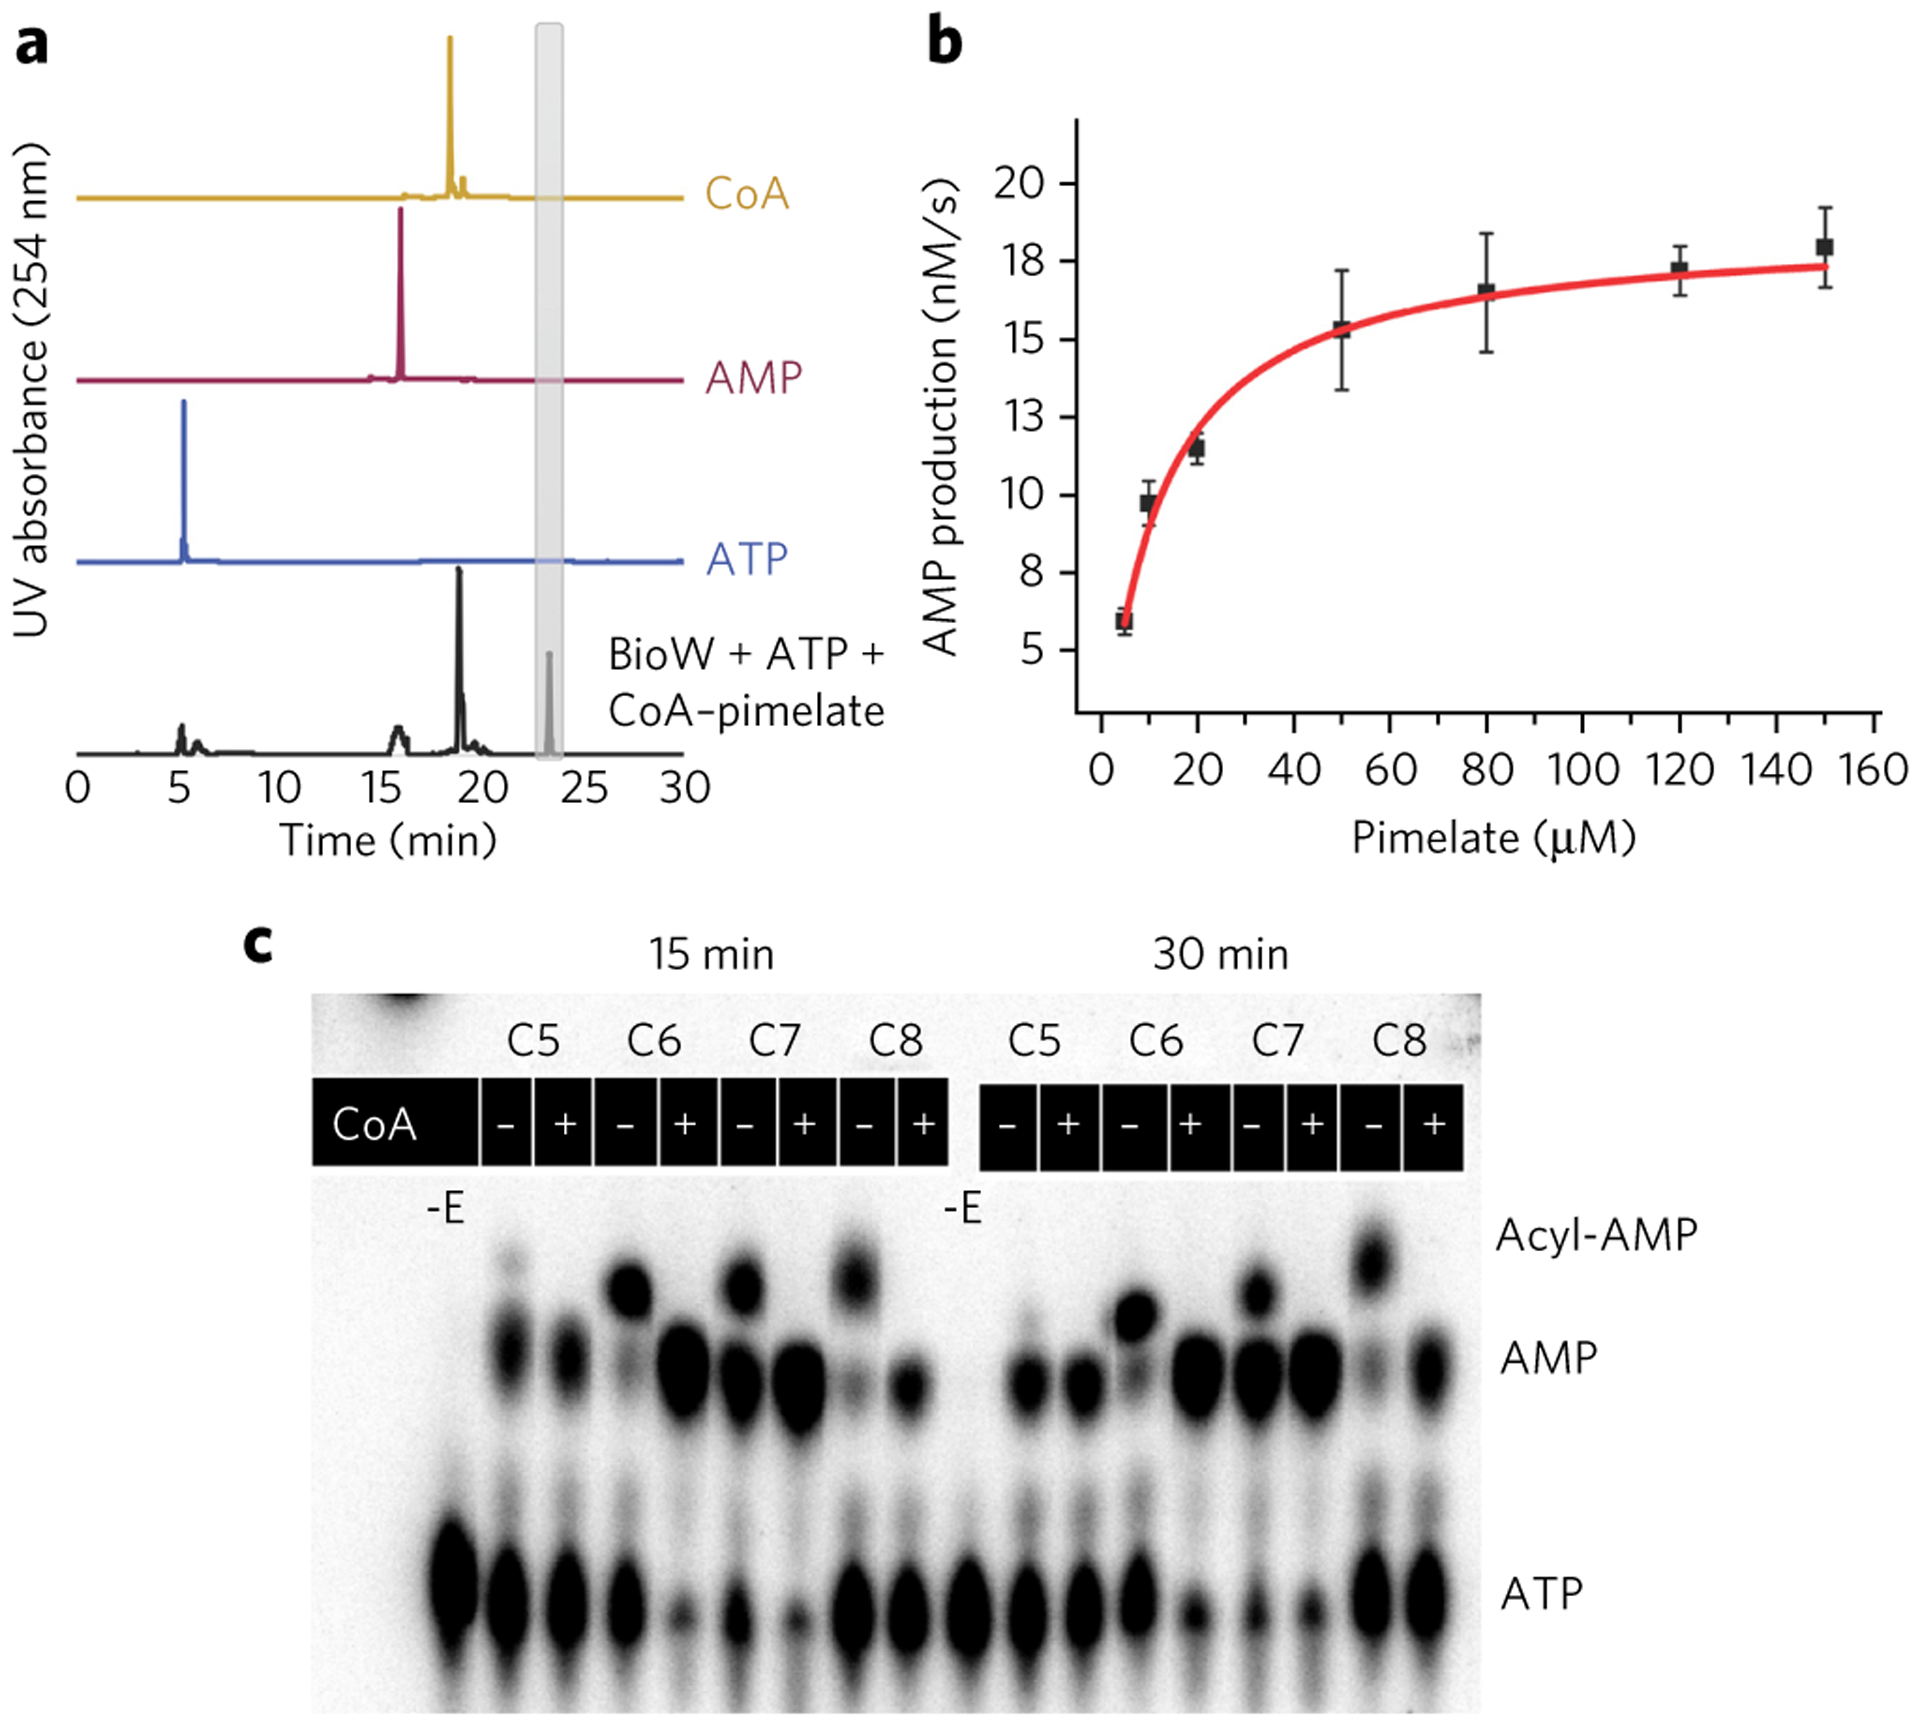
Figure 2 |. Biochemical activity of AaBioW.

(a) Formation of pimeloyl-CoA by AaBioW analyzed by HPLC analysis (black trace). The elution profiles for the isolated standards are shown in the lines above. (b) Michaelis–Menten curve obtained by measuring the AMP production over varying concentrations of pimelate with fixed concentrations of ATP (0.4 mM) and CoA (0.3 mM). Error bars represent mean ± s.d. Measurements were conducted in triplicate. (c) The proofreading activity of AaBioW was monitored using a range of dicarboxylic acids, including the cognate (C7) pimelate. –E, reactions that lacked enzyme.
