
Figure 3 |. Crystal structures of AaBioW and ligand complexes.
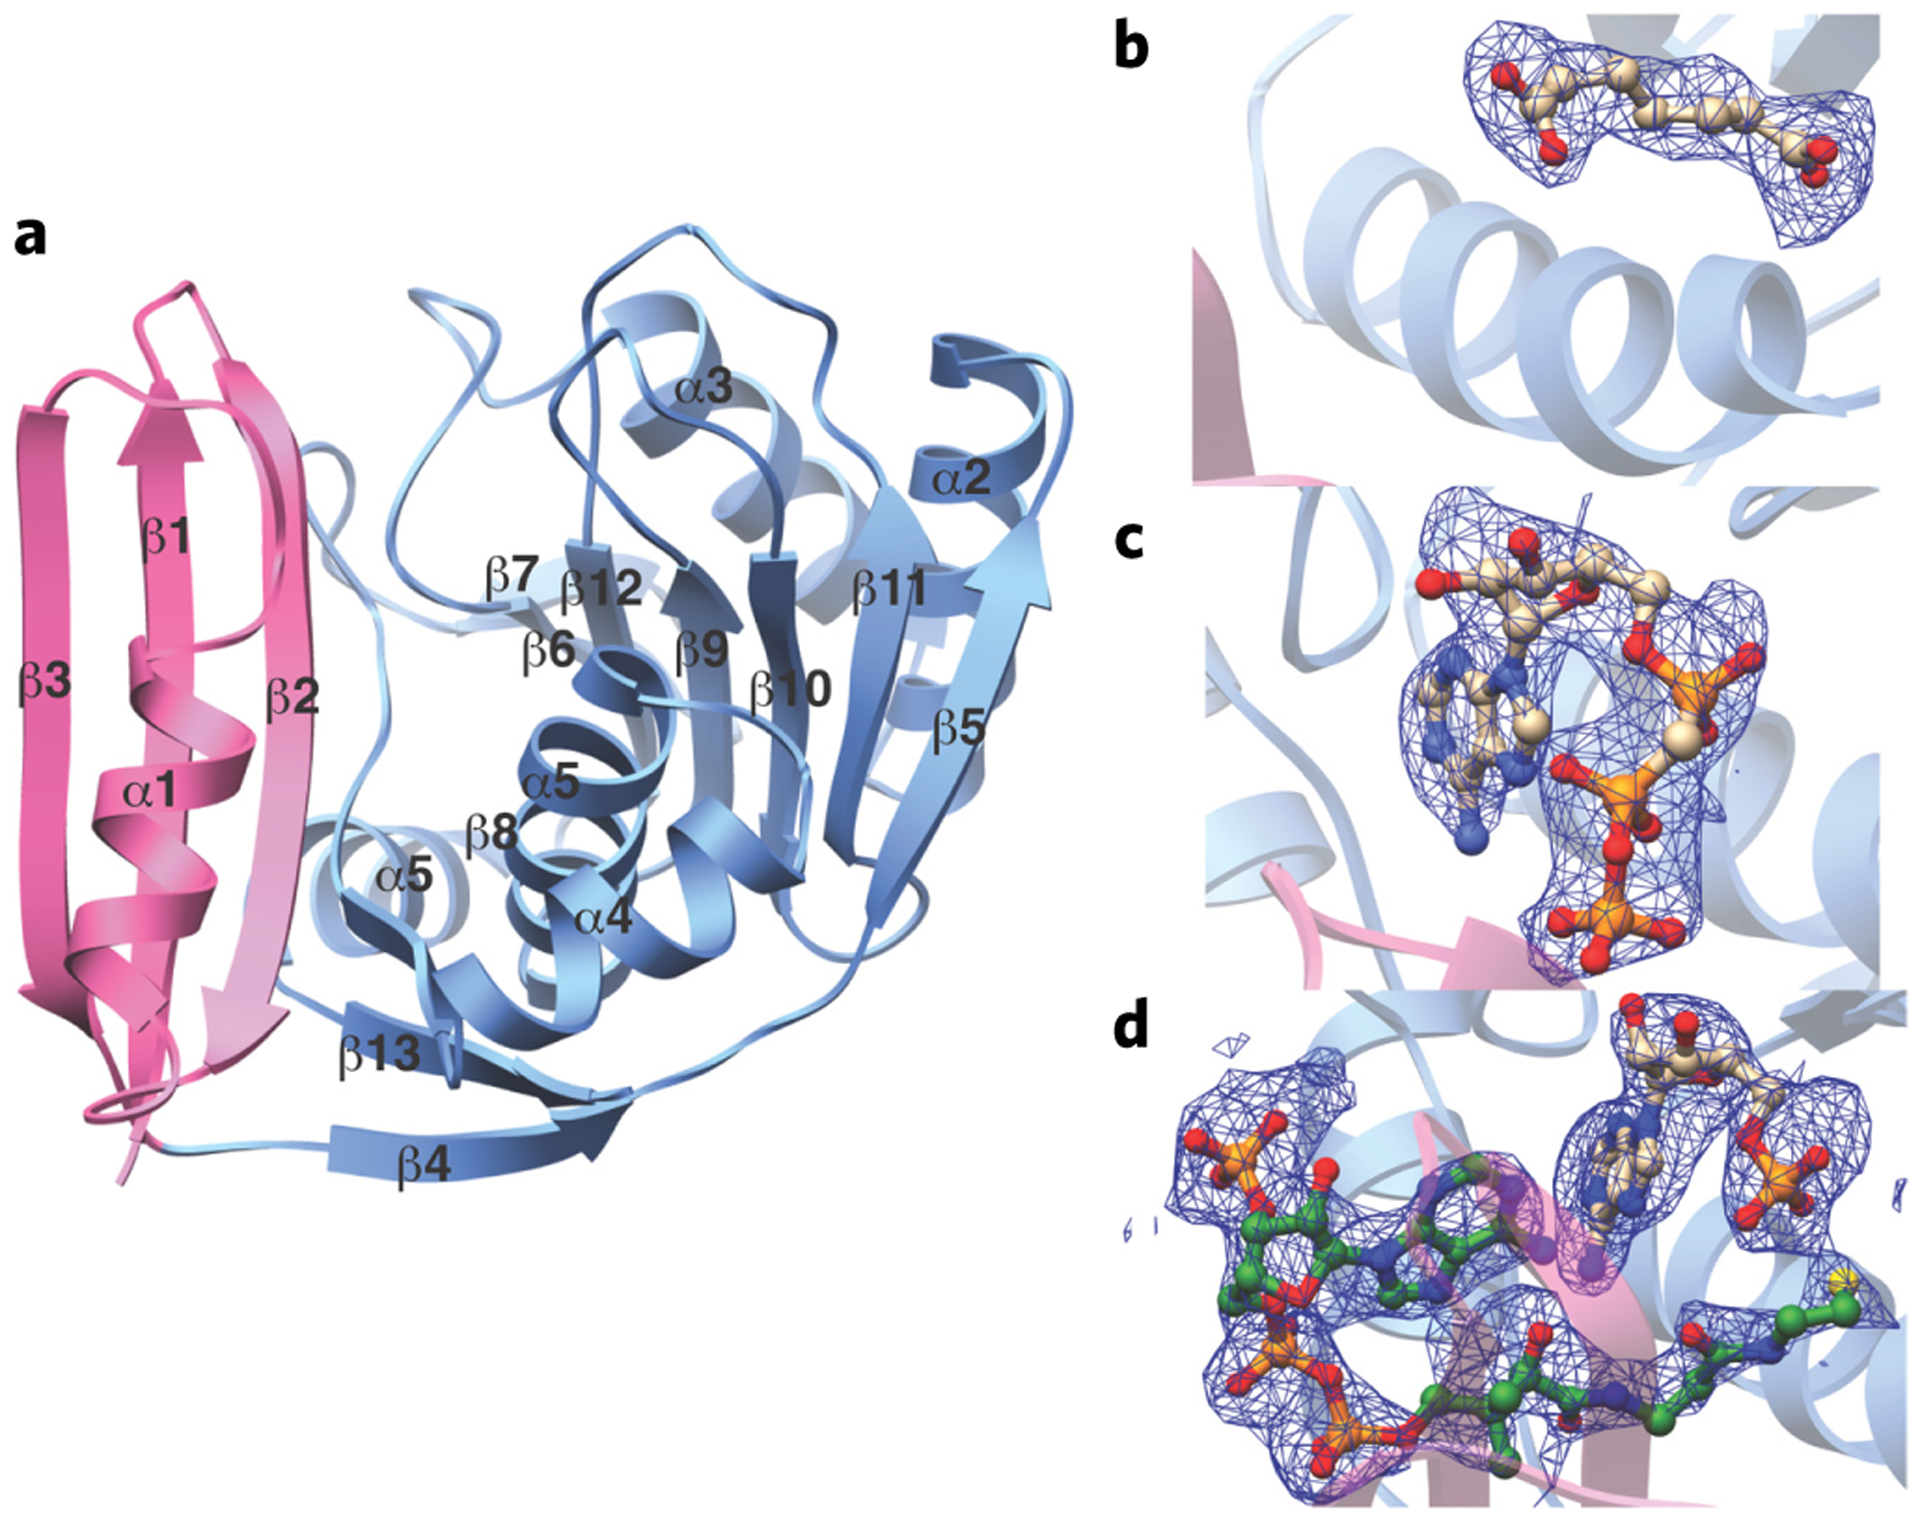
(a) Ribbon diagram of AaBioW illustrating the orientation of the PII domain (in pink) and the Rossmann fold domain (in light blue). Secondary structural elements are demarcated. (b–d) Simulated annealing difference Fourier maps (Fo – Fc) of AaBioW complexes contoured to 2.5 σ (blue) showing the bound pimelate (b), AMP–CPP–Mg2+ (c), and AMP–CoA (d). The coordinates for ligand were omitted before map calculations. The coordinates of the complexes are superimposed and the ligands are shown in ball-and-stick representation.