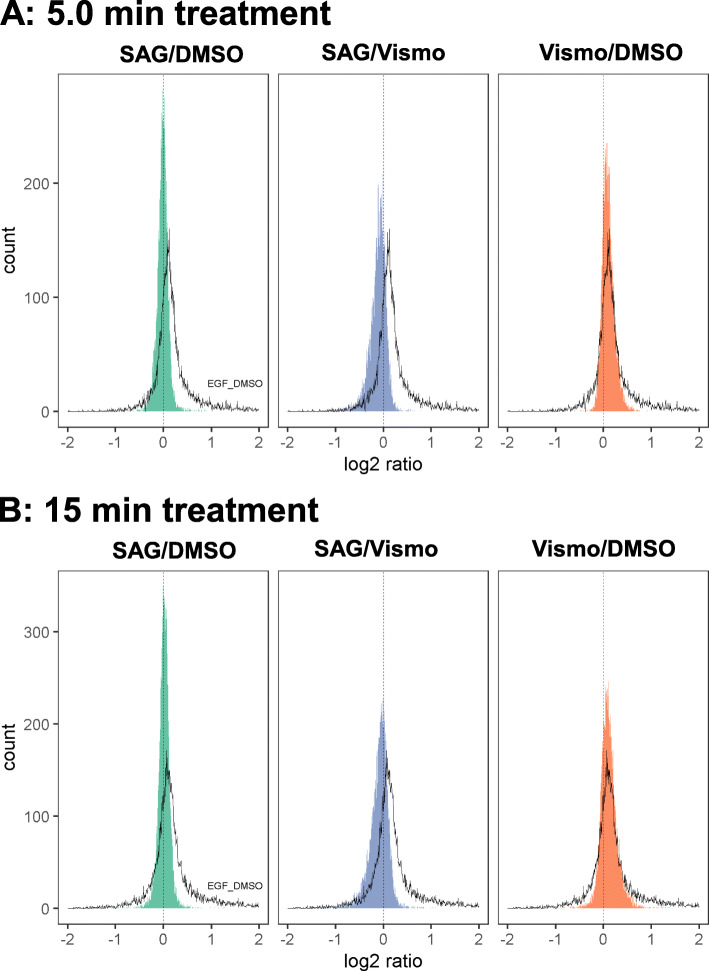
Fig. 2.
Distribution of proteome normalized ratios of phosphopeptides identified after 5.0 min treatment (a) and 15 min treatment (b). Intensity values of each channel of the phosphoproteome were normalized by correction factors derived from respective channels of the measured proteome. Ratios were determined by the mean of the treatment SAG or vismodegib (N = 3) divided by the mean of DMSO (N = 3) of the respective time point. SAG/DMSO (green graph) represents the distribution of the phosphopeptide ratios of SAG treatment compared with DMSO treatment, whereas Vismo/DMSO (orange graph) describes the distribution of phosphopeptide ratio of vismodegib treatment compared to control (DMSO) treatment. The ratio was determined by division of the proteome-normalized intensity by the mean of DMSO treatment. SAG/Vismo (blue graph) describes the phosphopeptide ratio generated by division of SAG/DMSO by Vismo/DMSO

