Fig. 3.
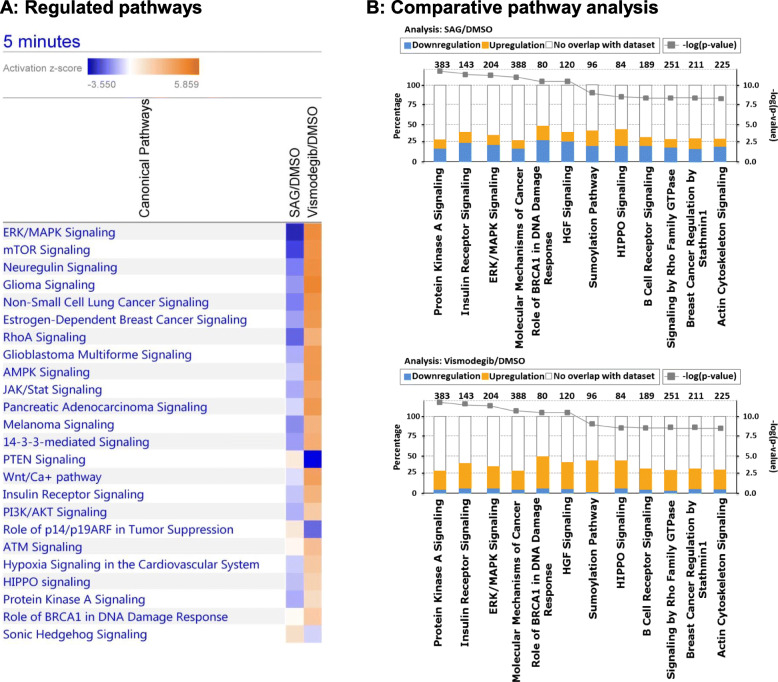
Ingenuity pathway analysis of all phosphopeptides identified after 5.0 min. a Comparative analysis of regulated pathways after SAG and vismodegib treatment. Pathways were manually filtered for cancer relevance and the log10 p-value cut-off was set to 1.3. Activated pathways are shown in orange, inhibited pathways in blue. b Top 12 significantly enriched pathways after 5.0 min SAG (upper bar chart) and vismodegib treatment (lower bar chart). The total number of phosphoproteins which are assigned to a particular pathway are displayed on top of the particular bar, share of those phosphoproteins identified in the experiment is represented by the primary x-axis, while the –log p-value determined by Fisher’s exact testing is represented by the secondary y-axis. The proportion of upregulated phosphoproteins is shown in orange, downregulation is indicated by blue bars

