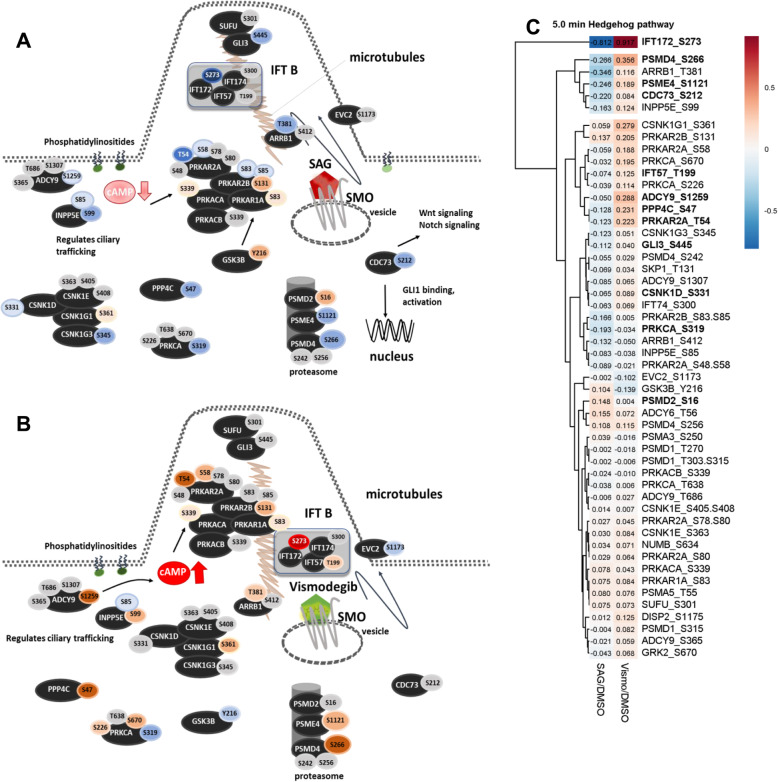
Fig. 5.
Phosphorylation of HH pathway components after 5.0 min treatment. a SAG binding to Smoothened induces ciliary trafficking after 5.0 min stimulation. b Vismodegib treatment induces phosphorylation and increases cAMP levels after 5.0 min treatment. c Heatmap of regulated and identified phosphosites after 5.0 min SAG and vismodegib treatment. Blue and red ellipses represent phosphosites down- or upregulated compared to control. All quantified phosphopeptides of phosphoproteins after 5.0 min treatment assigned to sonic hedgehog signaling were considered for the heatmap without applying any cut-off value. SAG/DMSO represents the ratio determined by the mean of the proteome-normalized intensities detected after SAG treatment (N = 3) divided by the mean of proteome-normalized intensities after DMSO (N = 3). Vismo/DMSO represents the ratio determined by the mean of proteome-normalized intensities detected after vismodegib treatment (N = 3) divided by the mean of proteome-normalized intensities after DMSO (N = 3). Significantly regulated phosphopeptides between SAG and vismodegib treatment are highlighted in bold. Significantly regulated phosphopeptides between SAG and vismodegib treatment are highlighted in bold

