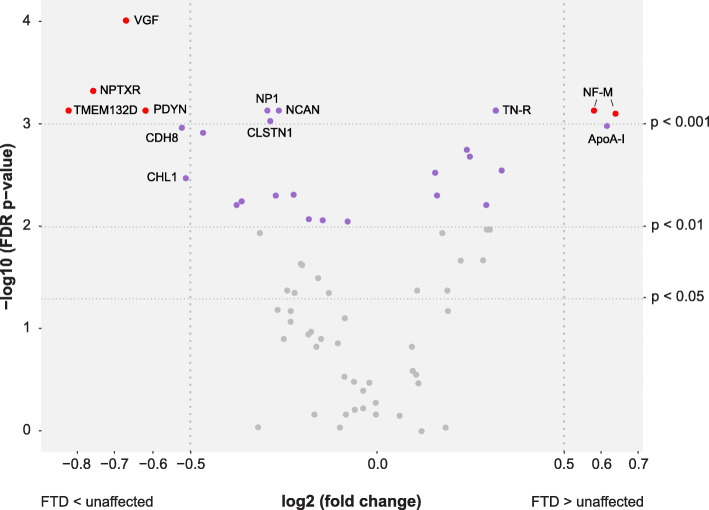
Fig. 2.
Volcano plot of analysed proteins (n = 70). Differences in protein levels between FTD patients and unaffected individuals displayed by log2(fold change) and significance level displayed as -log10(p). All proteins with significant differences (FDR adjusted p < 0.01) are displayed in purple. Proteins highlighted with gene names have a p < 0.001 or an absolute log2(fold change) > 0.5 (corresponding to a fold change < 0.7 or > 1.4). The five proteins with both a p < 0.001 and an absolute log2(fold change) > 0.5 are displayed in red

