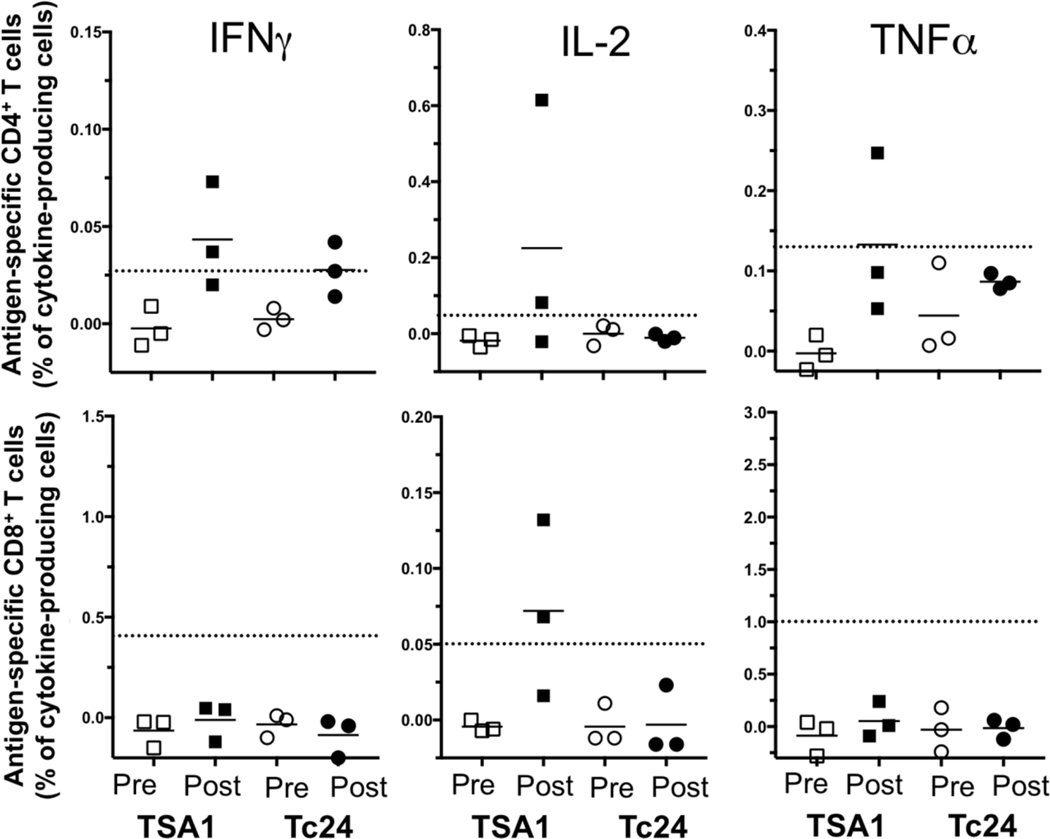
Figure 4. Cytokine-producing T cells in vaccinated rhesus macaques.
The cellular immune response was evaluated before vaccination (Pre, open symbols) and one month after the third vaccine doses (Post, closed symbols). The frequency of antigen-specific (Squares: Tc24-C4; Circles: TSA1-C4) cytokine producing CD4+ (Top row of panels) and CD8+ T cells (Bottom row of panels) was calculated by subtracting the background frequency of unstimulated cells to that of peptide-stimulated cells. The dotted horizontal lines indicate the cut-off to consider a positive response, defined as two-fold the frequency of cytokine-producing unstimulated cells. Data points represent individual rhesus macaques.

