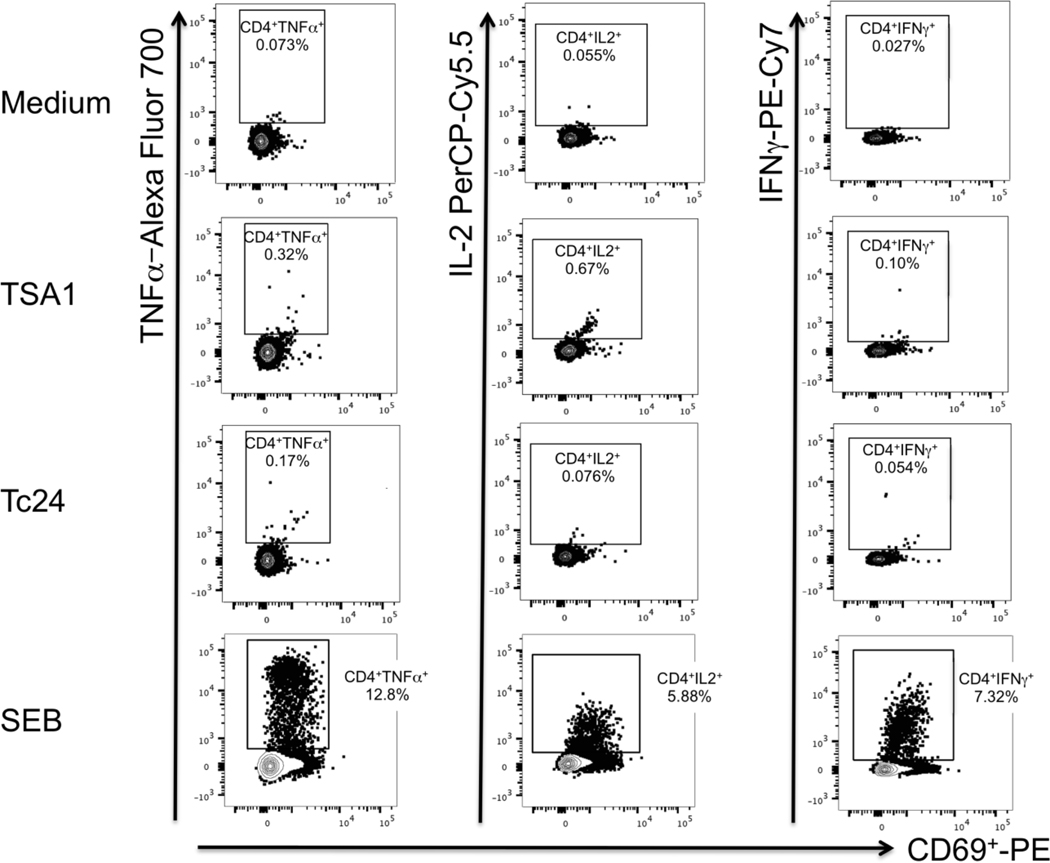
Figure 5. Dot plots of cytokine-producing CD4+ T cells.
Cells were analyzed by flow cytometry, and CD4+ T cells were gated as described in the methods section. Responses from rhesus KL72 are shown for unstimulated control cells (Medium, top row of panels), TSA1 peptide pool (upper middle row of panels), Tc24 peptide pool (lower middle row of panels), and SEB (bottom row of panels) stimulation. Percentages of cytokine-producing CD4+ T cells are indicated in each panel for TNFα (Left column panels), IL-2 (middle column panels) and IFNγ (Right column panels).

