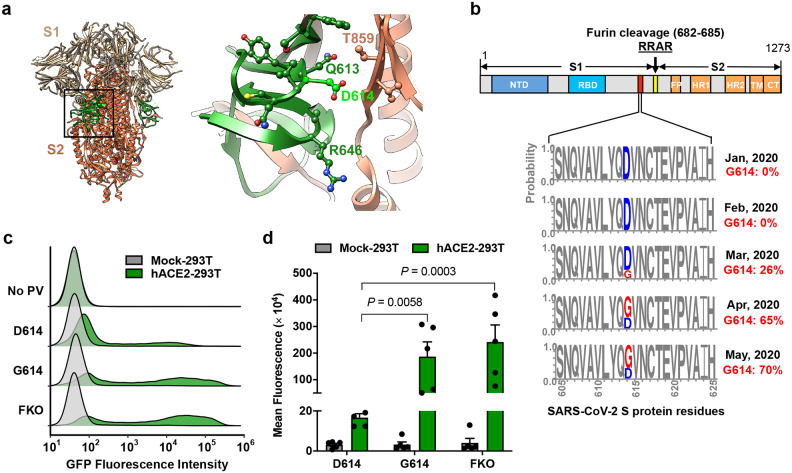
Figure 1. The D614G mutation is associated with enhanced infectivity.
Cryo-EM structure of S1 (grey) and S2 (orange) heterodimer (PBD 6VXX). The residues 581–676, a C-terminal region of the S1 domain involved in S2 interaction, is shown in green. Aspartic acid 614 is shown in light green. The area indicated with a black square is presented magnified at the right. Residues within 5.5 Å of D614 are shown in a ball-and-stick representation. b, A representation of the SARS-CoV-2 Sprotein (upper panel) and D/G variation at the residue 614 presented in logo plots at different time points between January 1st and May 30th, 2020 (lower panel). Total number of sequences analyzed: 17 in January, 33 in February, 293 in March, 1511 in April, and 2544 in May. NTD: N-terminal domain, RBD: Receptor-binding domain, FP: Fusion peptide, HR1 and HR2: Heptad-repeat region 1 and 2, respectively, TM: Transmembrane region, CT: Cytoplasmic tail. c,d, Mock- and hACE2-293T cells on 96-well plates were infected with MLV PV (5 × 10⁸ vector genome per well) expressing GFP and pseudotyped with the indicated viral glycoprotein and analyzed 24 h later. Representative histograms (c) or mean ± SEM (d) of five experiments conducted using two independent PV preparations are shown. Each dot in (d) indicates an average value of a duplicated experiment. Significant differences were analyzed by two-way ANOVA with Sidak multiple comparisons test. PV titers are presented in Extended Data Fig. 1. FKO: Furin-cleavage knockout mutant.

