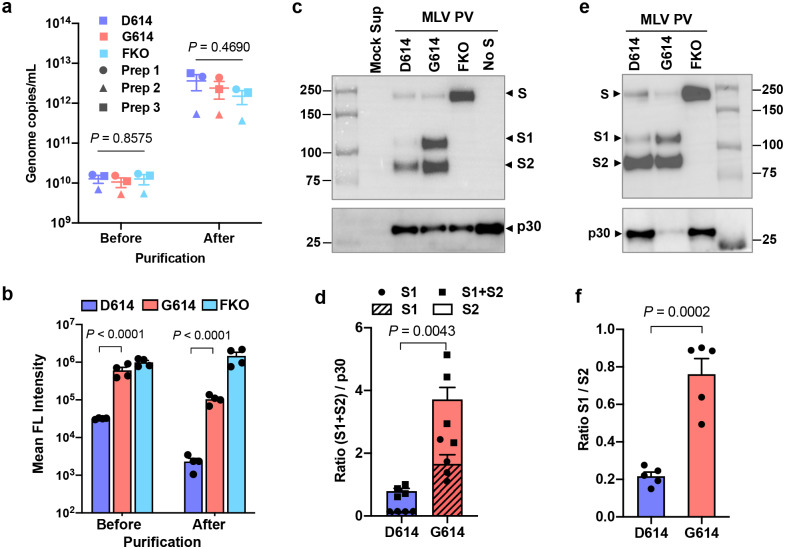
Figure 2. Superior infectivity of G614 results from decreased S1 shedding and higher level of S protein in the virion.
a–f, Indicated MLV PVs produced with the S protein containing the Flag tag at both the N- and C-termini were partially purified and concentrated by pelleting through a 20% sucrose layer. PV titers were assessed by RT-qPCR (a). The same symbols in different PV groups indicate they are from the same batch. The same PVs were assessed for their infectivity in Mock- and hACE2-293T cells (b). Each symbol in (a,b) indicates an average value of a duplicated experiment. Mean ± SEM of three independently prepared PVs (a) and four experiments using those three PV batches (b) are shown. The same amount (1 × 10¹⁰ vg per lane) (c,d) or to more accurately compare the S1 and S2 ratio, different amount (e) of the purified PVs were analyzed by WB using the anti-Flag M2 antibody or anti-p30 MLV gag antibody. A similar experiment performed with an independently prepared batch of PVs is shown in Extended Data Fig 2a. The same PVs visualized by silver stain is shown in Extended Data Fig. 2b. Total virion S protein (d) and the S1/S2 ratio (f) of PVD614 and PVG614 were calculated from four (d) or five (f) WBs performed with three independently prepared PV batches and presented as mean ± SEM. Significant differences were analyzed by one-way ANOVA (a), two-way ANOVA with Sidak multiple comparison tests of log-transformed data (b), or unpaired Student’s t-test (d,f).

