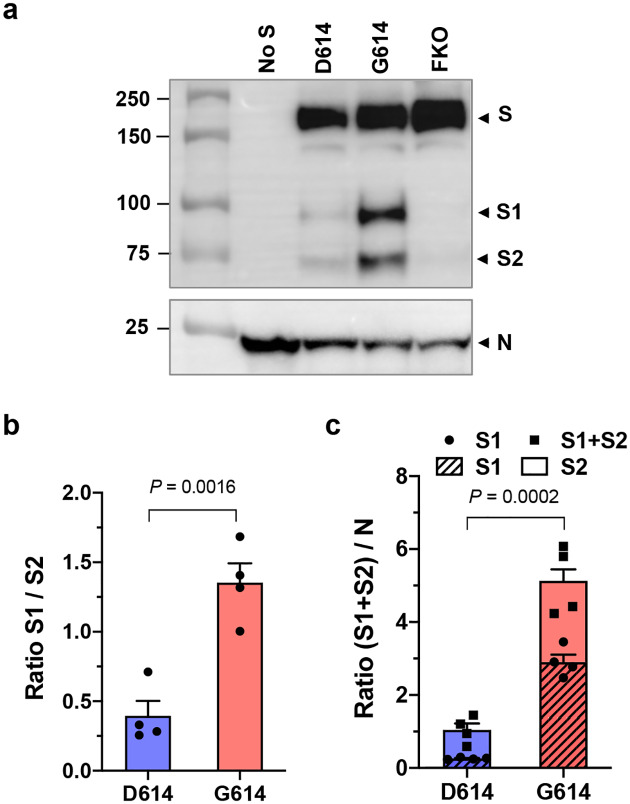
Fig. 3. SARS-CoV-2 VLPG614 also exhibits decreased S1 shedding and increased total virion S protein.
a–c, VLPs were produced from HEK293T cell transfection of the M, N, E, and S proteins of SARS-CoV-2. VLPs were harvested from the culture supernatant and partially purified as MLV PVs. The S protein bands were visualized using the anti-Flag tag M2 antibody and the N protein band using pooled convalescent plasma (a). A representative of WBs performed with three independently prepared VLPs is shown. The S1/S2 ratio (b) and the difference in total virion S protein (c) incorporated into the VLPD614 and VLPG614 were calculated from four WBs performed with three independent VLP preparations and presented as mean ± SEM. Significant differences were analyzed by unpaired Student’s t-test.

