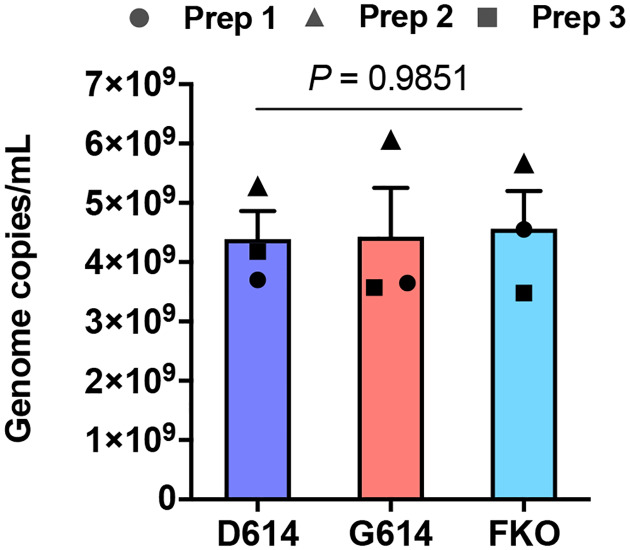
Extended Data Fig. 1. Titers of various MLV PVs.
The titers of the MLV PVs used in the experiments shown in Fig. 1c,d were quantified by RT-qPCR. The same symbols in different PV groups indicate they were from the same batch. Each symbol indicates an average value of a duplicated experiment. Similar PV titers validate that enhanced infectivity of PVG614 was not resulted from a large difference in virus titers and/or normalization thereof. Mean ± SEM of two independent PV preparations are shown. Significant differences were analyzed by one-way ANOVA.

