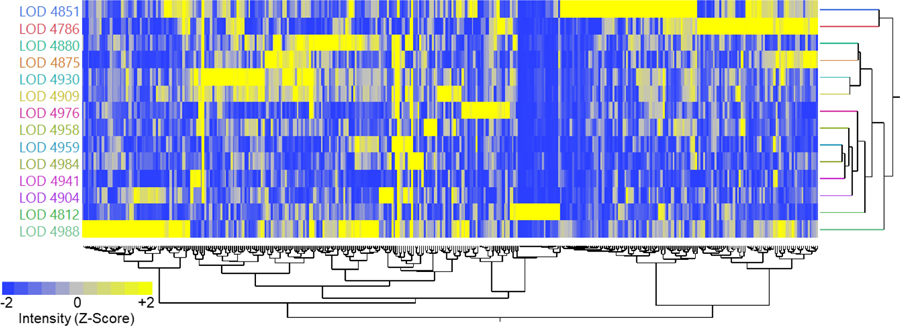
Figure 4.
2D Hierarchical clustering, after Z-Score transformation, of the LOD values observed during FIA-MS experiments from each lab. Bright yellow indicates 2 or more standard deviations above the mean for that analyte, interpreted as a measurement with higher than average background for the accurate mass region corresponding to a particular lipid signal. The important finding is that stochastic background from undetermined sources, which vary between labs, may play a key role for inter-laboratory reproducibility for low abundance lipid measurements.

