
Figure 2.
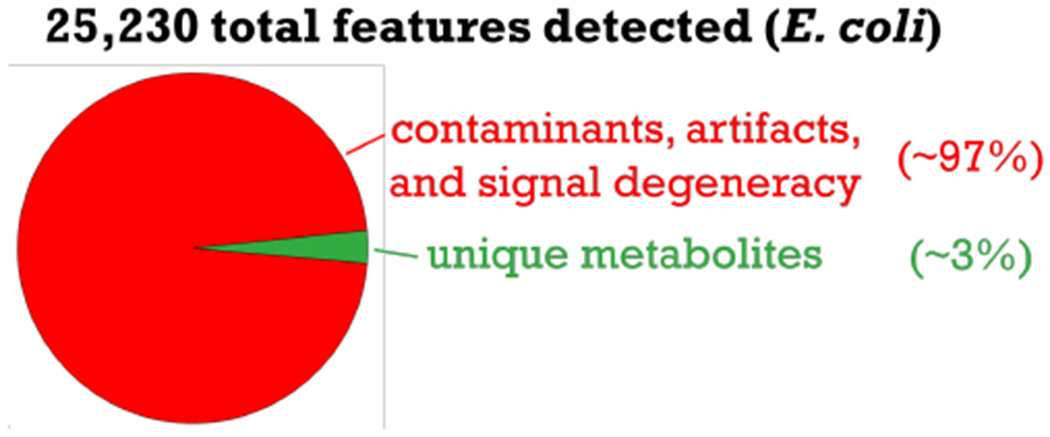
Adapted from slide presented by Gary Patti at the Fall Workshop. Chart illustrates that most features detected in the E. coli dataset shown arise from contaminants, artifacts, and signal degeneracy (i.e., adducts, naturally occurring isotopes, dimers, etc.)