
Figure 2: Abundance of IgA and pIgR transcripts appears to be highly coordinated throughout lactation.
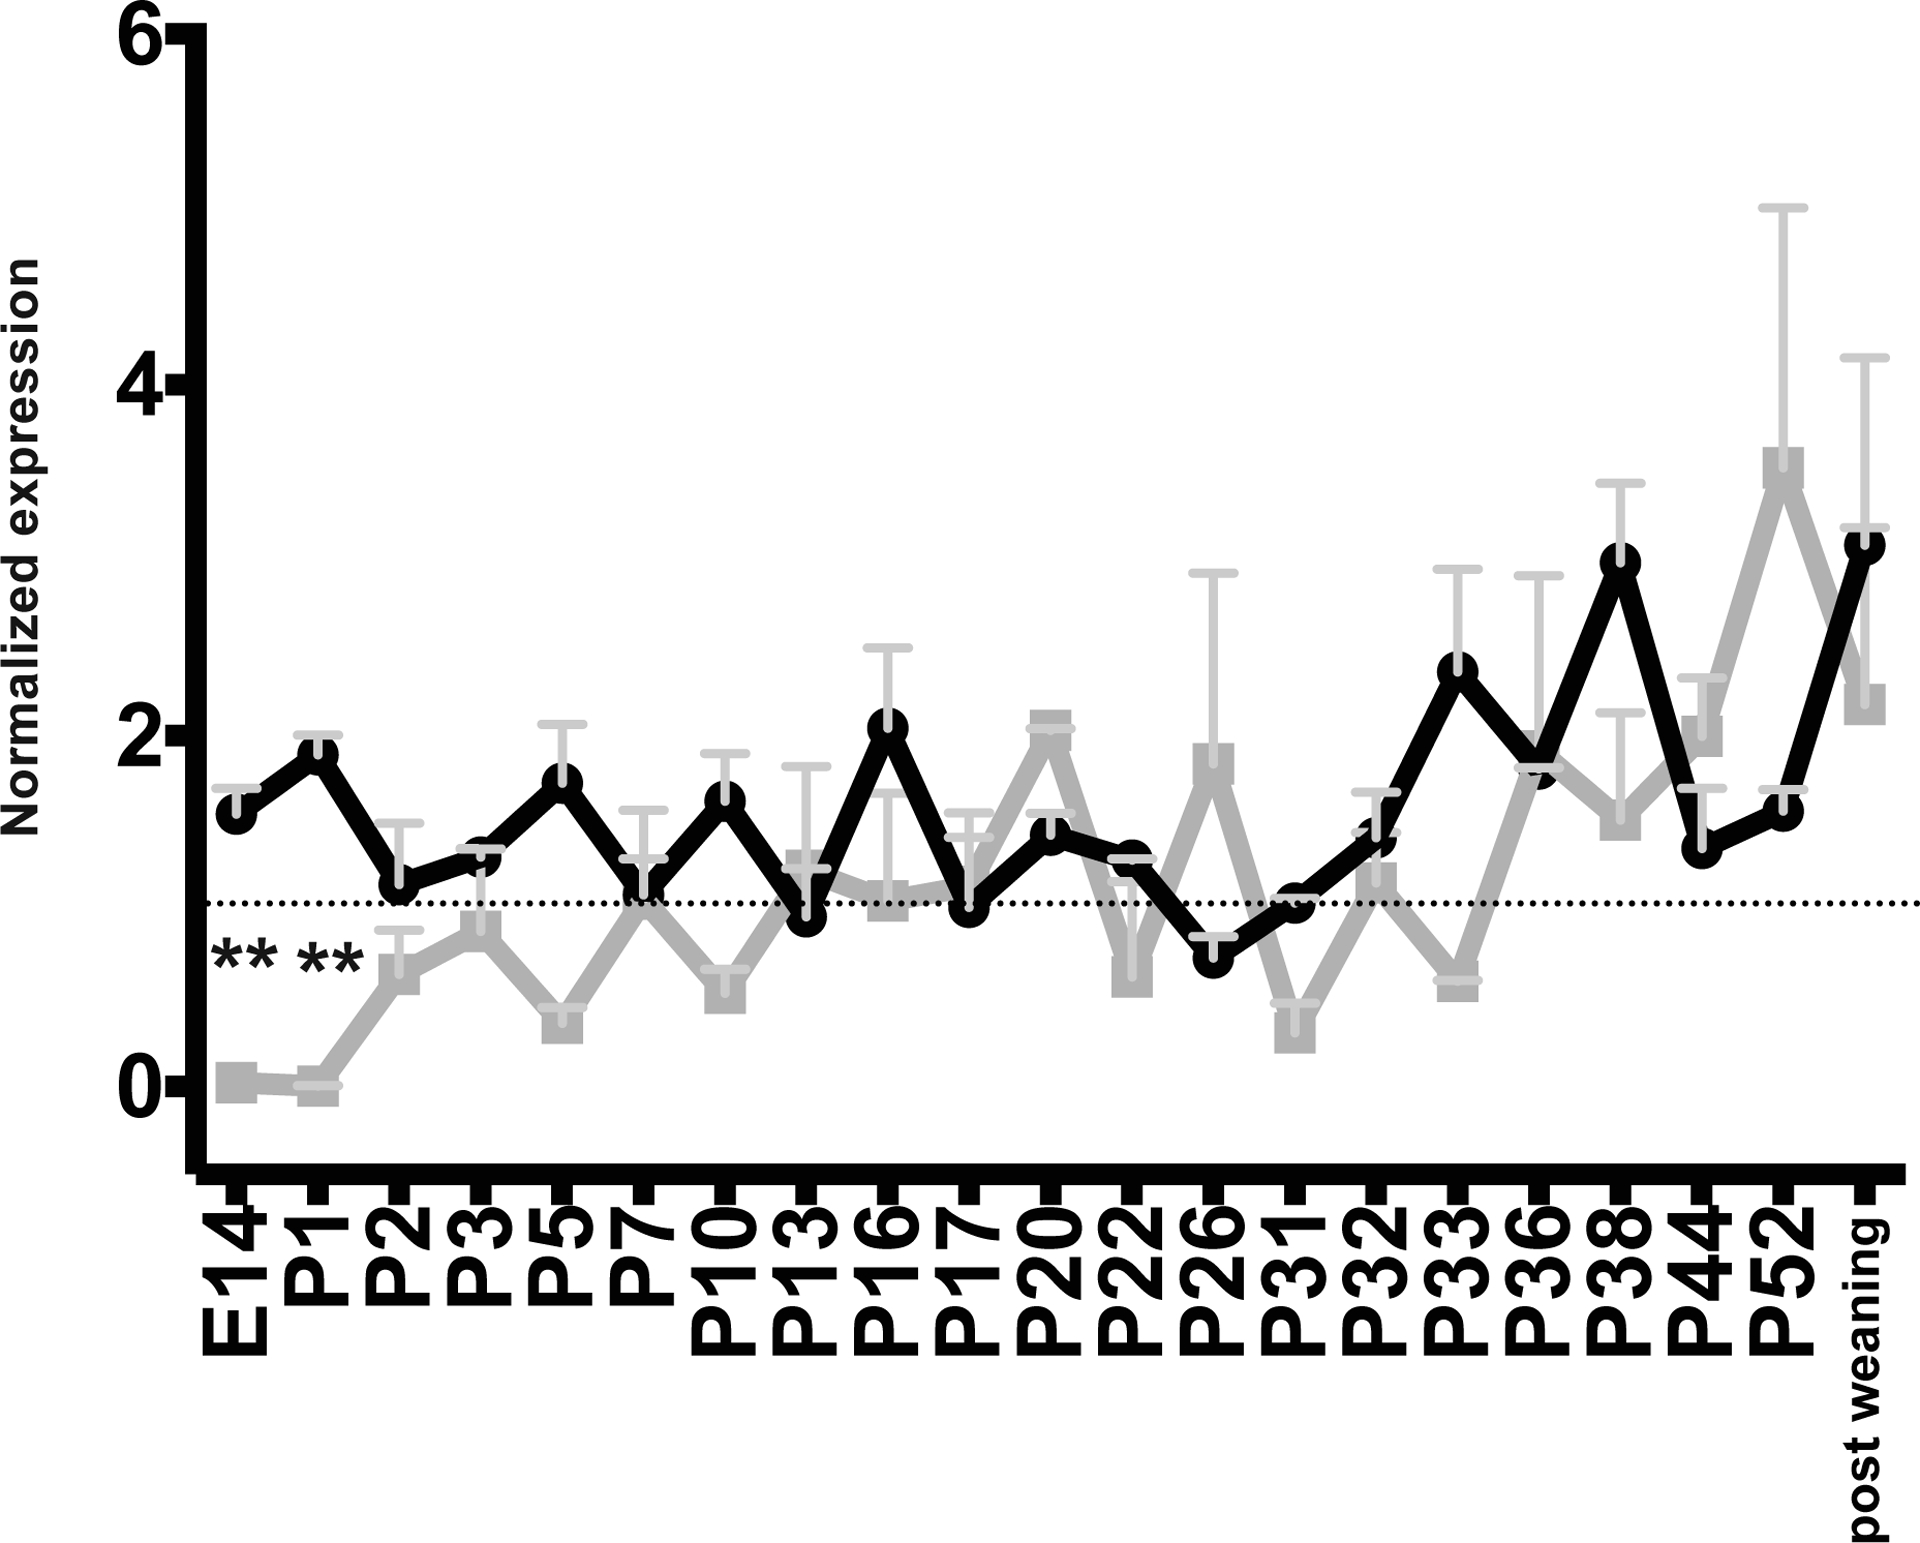
IgA (gray line) and pIgR (black line) transcript abundance reported by day. Annotations as in Figure 1.
Official websites use .gov
A
.gov website belongs to an official
government organization in the United States.
Secure .gov websites use HTTPS
A lock (
) or https:// means you've safely
connected to the .gov website. Share sensitive
information only on official, secure websites.
IgA (gray line) and pIgR (black line) transcript abundance reported by day. Annotations as in Figure 1.