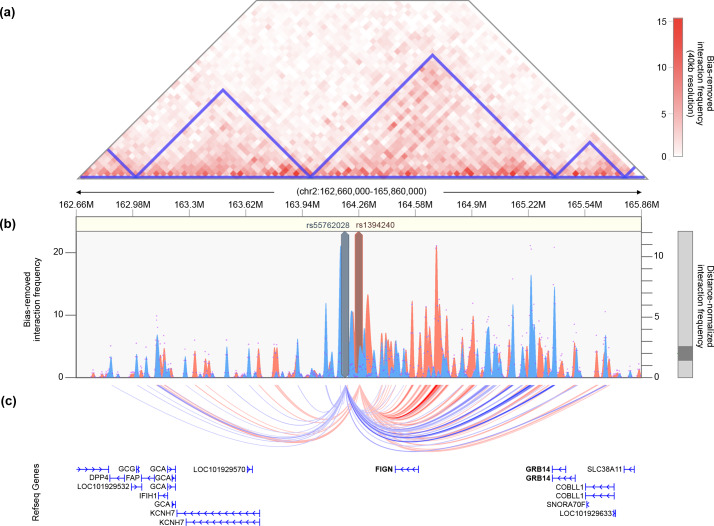
Fig 9. Chromatin interaction map of KCHN7/FIGN locus.
(A) Shown is the interaction frequency heatmap from chr2:162,660,000 to 165,860,000 in pancreatic tissue. The color of the heatmap indicates the level of normalized interaction frequencies with blue triangles indicating topological association domains. (B) One-to-all interaction plots are shown for the lead SNP (rs13401392; shown in blue) and second-leading SNP (rs1394240; shown in red) as bait. Y-axes on the left and the right measure bias-removed interaction frequency (blue and red bar graphs) and distance-normalized interaction frequency (magenta dots), respectively. (C) The arc representation of significant interactions for distance-normalized interaction frequencies ≥ 2 is displayed relative to the RefSeq-annotated genes in the locus. chr, chromosome; SNP, single nucleotide polymorphism.

