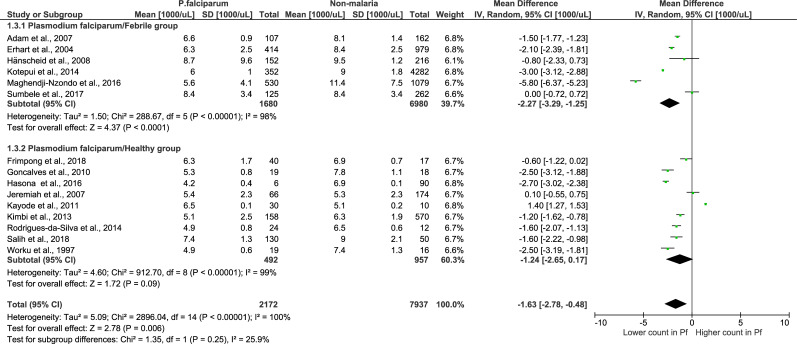
Fig 8. Subgroup analysis of P. falciparum.
Forest plot of subgroup analysis showing the total leukocyte count in the P. falciparum group compared to the febrile and healthy groups. [1000/μL] refers to 1000 per microliter; “IV" in "IV, Random” refers to Inverse variance; "Total" in top row refers to number of patients included; A green square in the horizontal line refers to the mean difference for each of included study.

