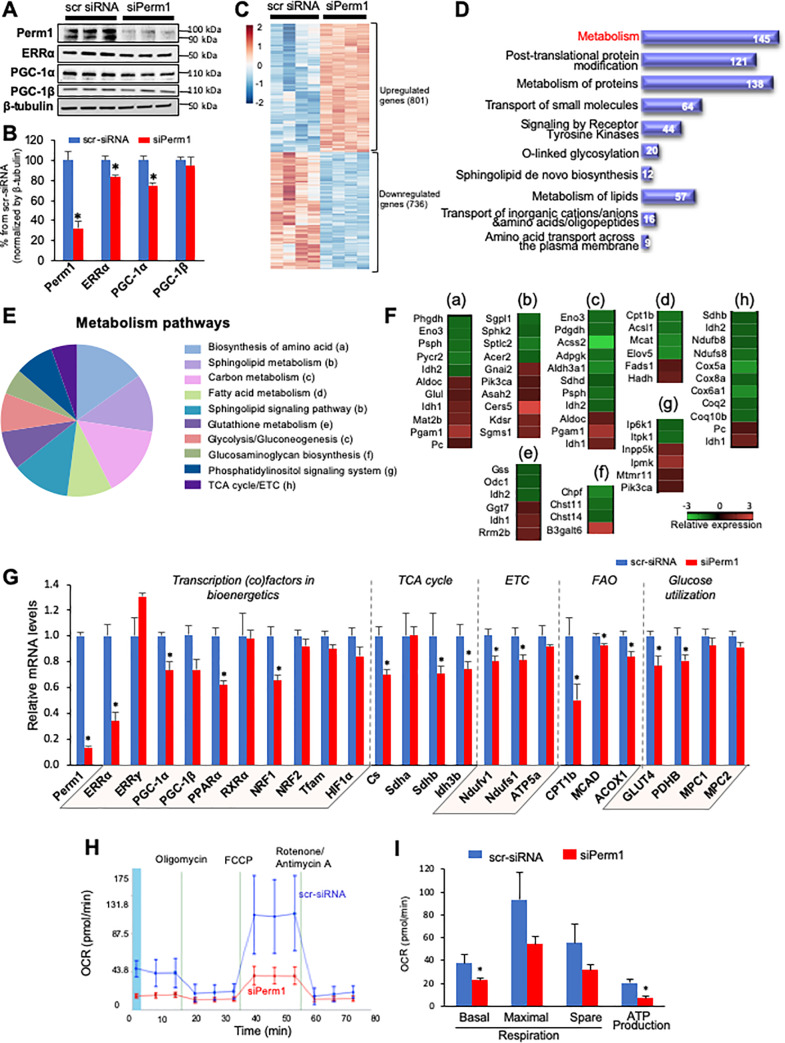
Fig 3. Perm1 positively regulates metabolism in cardiomyocytes.
(A-B) Western blot analysis showing a significant reduction in the endogenous protein levels of Perm1, ERRα, and PGC-1α in NRVMs that were transfected with siPerm1, as compared with control cells that were treated with scrambled-siRNA (scr-siRNA) (n = 4/group). (C-F) Illumina-based RNA-seq showing that differentially expressed genes in siPerm1 NRVMs as compared with control include 801 upregulated genes and 736 downregulated genes (n = 4/group, p<0.05, Panel C, also see S2 Dataset). Enrichment analysis of significantly regulated genes for the Reactome terms biological pathways shows that the pathway most affected by Perm1 knockout is metabolism (Panel D, S3 Dataset). Pie charts representing the major metabolic pathways of differentially regulated genes involved in metabolism in siPerm1 cardiomyocytes (Panel E, S4 Dataset). Heat maps of genes comprising the pie chart presented in Panel E display the dictionary of changes by Perm1 knockout (Panel F). (a) Biosynthesis of amino acid, (b) Sphingolipid metabolism and signaling pathway, (c) Carbon metabolism and glycolysis, (d) Fatty acid metabolism, (e) Glutathione metabolism, (f) Glucosaminoglycan biosynthesis, (g) Phosphatidylinositol signaling system, (h) TCA cycle / electron transport chain (ETC). (G) qRT-PCR showing the expression of genes involved in energetics in Perm1-knockdown (siPerm1) led to downregulation of energetics-related genes as compared to in control cells (n = 3-5/group, ±SEM). (H) Cell Mito Stress Test was performed using a Seahorse XF96 analyzer (n = 8/group, ±SD). O2 consumption rate (OCR) was measured in the presence of glucose as a major respiration substrate. (I) Results were normalized by nuclear staining as described in our publication [2]. Error bars are ±SEM. Statistics were performed using the t-test with 2 tails. *p<0.05.

