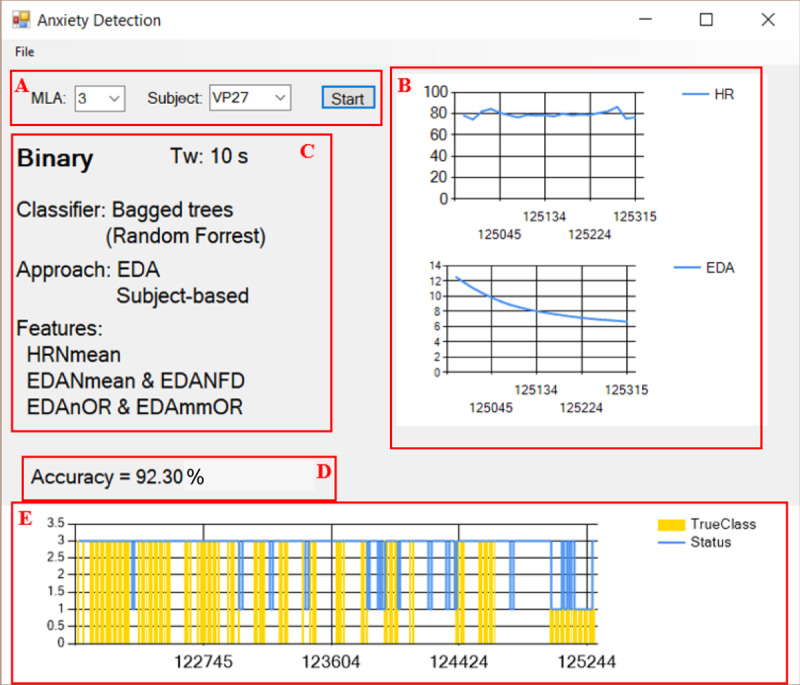
Fig 8. Graphical user interface of the Windows desktop application.

(A) Inputs—Machine learning algorithm (MLA) and subject, (B) On-line plots of HR and EDA, (C) Details of the selected algorithm, (D) Calculated accuracy only considering the true classes, (E) On-line prediction status (blue line) and true class according to the labeled data (yellow bars).
